Data centers and measurement of low frequency and infrasound
By David Woolworth, Roland, Woolworth & Associates, Oxford, MS
Data centers and their related power sources have become a hot topic in regard to noise among many other concerns. Each campus can be unique in size and composition, and in the resulting sonic signature and footprint. Data center noise sources consist of cooling systems (i.e. air or water cooling towers and chillers) which are well understood by themselves but can have interactions which may create unintended effects. In cases where power is generated nearby, the combination of sound sources poses an additional challenge to parsing out individual sources, in particular when power sources are permanent or temporary natural gas turbines, which are the fastest growing power sources for these centers [1,2]. In all cases the presence of low frequency sound is a concern, and poorly planned/rushed facility development can and do result in negative community impact stemming from low frequency and infrasound (LFIS). Many of the regulations (if there are any at all) utilize A-weighted criteria, which are insufficient to characterize LFIS.
Challenges for data centers sound level characterization through measurement are already numerous:
- Capturing baseline data (pre-construction) or allowable comparable baseline data
- Transience of data center/power sound sources, sometimes added to or altered over time, and cooling capacity requirements/energy demand change with the weather, time of day and year.
- Measuring long enough to capture the worst case propagation conditions, in particular at larger distances (1/2mile/0.8km+)
- By the time a consultant is onsite, there may have been multiple conditions that drove the original complaint that no longer exist. Barriers may be erected, and the systems, operations, and layout altered.
- The size of the campus and the access to the points in all directions at different distances around it to parse out multiple simultaneous sources, added to the challenge of transients.
As we are well aware, LFIS travel farther and penetrate building envelopes more easily than middle and high frequencies. Once inside a building it can be enhanced by resonances, and if levels are sufficient can set parts of the building into vibration. In the common example of thunder, we know that near a lightning strike there is a broadband crack sound that is attenuated by the atmosphere at long distances, leaving only the follow up low frequency rumble. The rumble following a lightning strike can be heard indoors distinctly and is capable of shaking buildings based on proximity to the source.
Characterization of LFIS from data centers and related power sources.
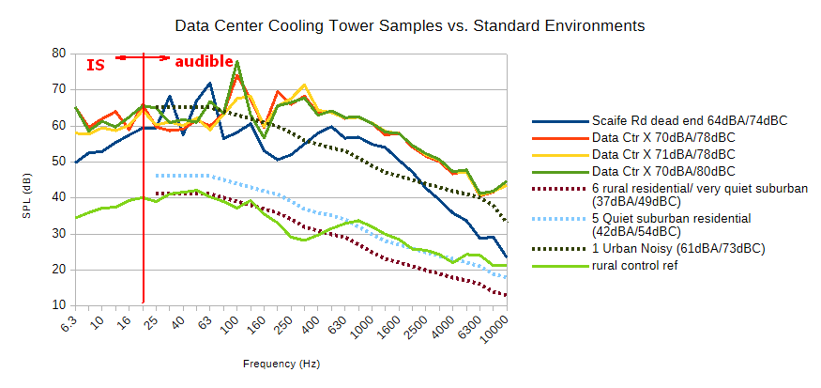
Figure 1 provides a look at characterization of cooling tower noise at two different sites. The graphs show the presence of low frequency tonal noise, at levels that can penetrate the facade of a residence. As an example, Data Center X exhibits pulsing or throbbing from interactions of fans, pumps and/or compressors, creating surges of low frequency noise that fluctuate at infrasound periodicity shown through short samples overlayed.
Natural gas turbine power sources are broken down into open and combined cycle (louder) and closed cycle, in order of increasing energy recovery systems. All systems can be fitted with attenuation measures, however in the case of a permanent installation, changes to the attenuation system require shutting the turbine down (prohibitive) and in temporary power generation, attenuation is often minimal due to the factors of expediency and cost. See Figure 2. The same pulsing or throbbing may be heard at power plants; over larger distances this audibility can be due to atmospheric effects.
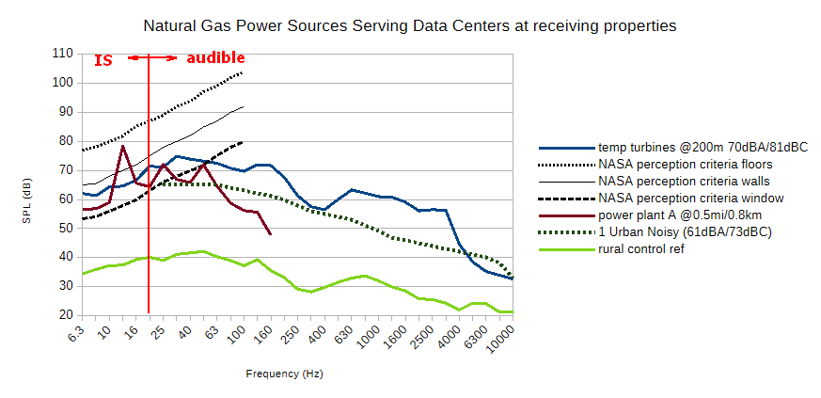
As seen from Figures 1 and 2, tonal and broadband components can be present, note that measurement penalties should be assessed to address tonal concerns (and pulsing). Also note that common background sound levels are shown for reference (ANSI 12.9 part 3); while the all cases shown in Figures 1 and 2 are real and are considered rather egregious, it should be noted that even lower levels of continuous noise from these sources directly impact the soundscape and quality of life experienced by residents indoors and outdoors. Single number regulations such as A-weight cannot properly quantify the human perception of this invasive and continuous sound in context, and this requires consideration.[4]
Measurement of LFIS
Challenges exist in accurate measurement of LFIS, in particular due to a lack of capabilities of common sound level meters and microphones, availability of practical LFIS sensors for longer term observation [5], and wind screens.
- Microphone and sound level meter sensitivity and tolerances vary in the infrasound region. It is critical the accuracy and frequency range meet the needs of the measurement.
- Lab calibration of measurement microphones primarily will be 20Hz+, with an assumption that the microphone is functioning as per specifications in the IS range. Specialized IS calibration exists, but is not readily available; commercial IS sensors are available, but this market is still developing. IS sensors can be calibrated, however this is also specialized and limited access. LFIS Sensors are ideal for deployments greater than short term measurements. [5]
- Wind noise is a special consideration with LFIS; the smaller the windscreen and the higher the windspeed, the higher the frequencies affected by wind induced noise (WIN); note that WIN consists of stagnation noise (the sensor interacting with the air flow) and non-acoustic pressure fluctuations caused by intrinsic turbulence. Larger windscreens can reduce intrinsic noise (see below). [6]
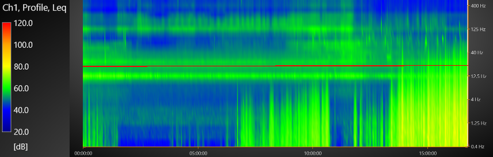
- As many of you have seen in the field, LFIS windscreen noise can show up at different sites and times, all within, say, 1/8 mile (0.2km) of one another, and gusting is a factor. For those that fly small planes or sail boats, you are aware of localized fluctuations in wind direction and speed. None of the truly local wind conditions are borne out by nearby weather station data, suggesting that LFIS measurements would be well served by a weather station at each monitoring point, within practical limitations. Figure 3 provides a graphical example of WIN/turbulence noise.
- Intrinsic turbulence is a non acoustic consideration that may be mistaken for infrasound or can easily mask infrasound. Turbulence is generated by heat, turbulent eddies interacting, and eddies interacting with the wind shear layer near the ground. Wavelengths of turbulence are a fraction of the size of the acoustic wavelengths of the same frequency, providing an opportunity to attenuate turbulent pressures with larger windscreens; turbulence effects increase drastically at the lowest frequencies. [5]
- IEC 61400-11 wind turbine standard defines windscreens sufficient to provide WIN/turbulence noise attenuation down to ~4 Hz, and some government requirements exist to limit the use of windscreens to this standard, however there are opportunities to use smaller hemispherical screens on the ground if the lowest measurement target frequency is higher, noting that it must be characterized against a standard windscreen for corrections. The purpose is to get sufficient WIN/turbulence attenuation to detect the presence of infrasound. Ideally we would use infrasound sensors with hemispherical screens at ground level.
- The LFIS standard ANSI S12.9 part 7 is adequate in its current state in terms of its prediction of wind noise based on windspeed and windscreen size/type, but there is room for improvement as these are minimum assumptions. [5] It is noted that S12.9P7 covers indoor and outdoor measurements.
- It can be seen from the information presented that A weighted single number measurements are insufficient to to characterize data centers and power plants; C weight is a start to address the audible sound spectra associated with data centers, but infrasound exceeds the typical local resources for measurement and legislation, creating a challenge for infrasound identification and management.
- Single metric G weight is recommended by ISO 7196 but must overcome equipment limitations discussed above. Equipment limitations may be best accommodated by providing reportable data. ISO 7196 does not address perception of vibration related to high infrasound levels.
- Multiple sources may further require a parsing of the individual sound sources to inform needed noise control efforts. Arrays of microphones or sensors can aid in this process, but may not be practical for simpler investigations. [7] Triangulation around a source is less accurate, but may be sufficient for source identification.
Propagation of LFIS
Commonly used outdoor noise modeling softwares utilize (a) temperature inversions and (b) assumed wind (gradient) profiles up to 100m based on windspeed at a given height above ground, and can be reasonably accurate up to 3km/2miles distance for a given condition and to predict worst case conditions (these models can be asked to calculate further, but accuracy suffers). The persistence of LFIS over greater distances suggests that we need to at least understand what can happen at longer distances, as predicting and modeling the atmosphere above 100m may be impractical for practitioners.
Upward traveling sound entering the “duct” at an angle under 20 degrees to the horizontal can be redirected downward at some distance, the remainder of the sound continues toward the stratosphere. However, LFIS is capable of traveling larger distances upward where it can encounter wind traveling in different directions at different speeds, and these other ducts can cause LFIS to be deposited at great distances in different directions. See Figures 4,5,6 real conditions taken from an investigation in Hutto, Texas.
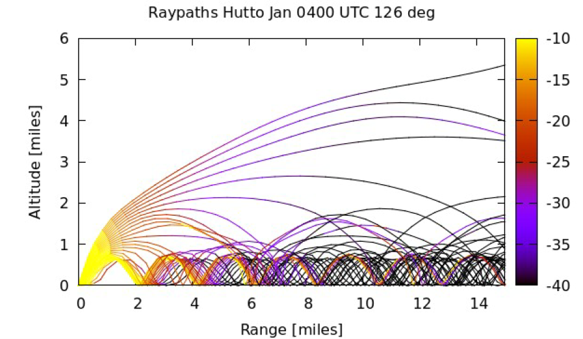
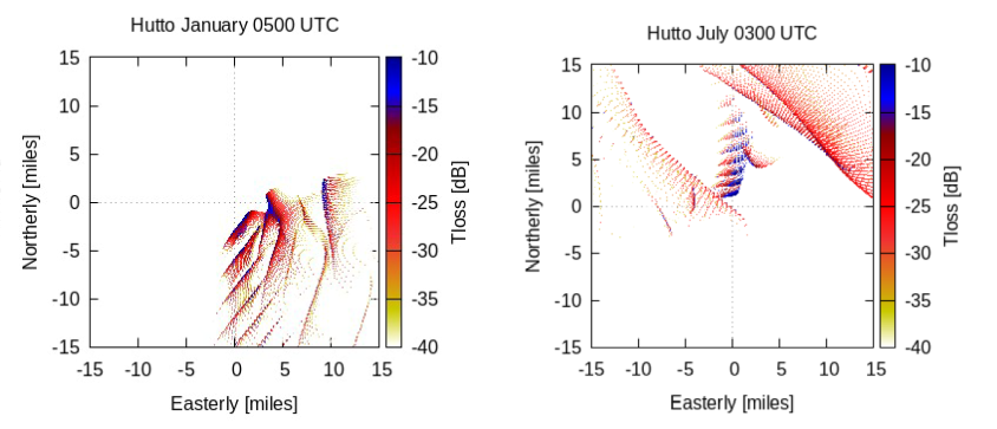
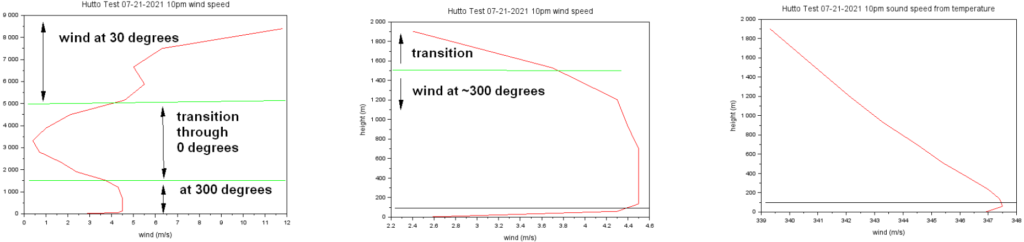
A rough estimate is if you have wind maxima/lobe at a given altitude, you can expect that sound to land 5x that distance downwind.
Returning to shorter range atmospheric propagation, if we look at the CONCAWE model, at 0.5miles/0.8km atmospheric effects can range from -12dB to +5dB at 1000Hz and -8 to +2dB at 63Hz. If we look a the potential fluctuations of perceived loudness (Fletcher-Munson), low frequencies and high frequencies are at least comparable in the perceived fluctuation (low to high 4x or ¼ as loud), however atmospheric absorption of middle and high frequencies leaves LFIS as the main concern at greater distances.
Exposure to LFIS and standards
Thresholds of perception of LFIS vary physiologically between people such that one person’s threshold of perception is another’s of pain; these mechanisms infrasound perception are still being investigated [8], and there is not yet an agreement on what constitutes a maximum allowable exposure limit. Negative health effects of LFIS exposure can vary from person to person as well, and include sleep disruption, stress, hypertension, headaches, inability to concentrate, disorientation, and increased risk of cardiovascular failure.
As noted above, for LFIS measurements (and by association exposure criteria), the A-weighting metric comes up short and C-weighting can be useful but not at the lowest audible frequencies into infrasound. Our concerns are twofold: (a) what are the thresholds of community response to LFIS and (b) how do we regulate/manage LFIS? In regard to exposure/level limits we can certainly begin with DIN 45680, NASA-TM83288, ANSI 12.9 part 4, and DEFRA LFN criterion. David Nelson has recently presented a paper at Noise-Con 2026 that assesses these methods and proposes new criteria for consideration [9]; this has potential to inform a new U.S./international standard. In regard to local management of LFIS, this will require some innovative thinking: all regulations/laws are only as useful as the enforcement and judiciary resources permit, and the complexities of LFIS require specialized resources beyond most cities, let alone suburban and rural communities.
This article lightly covers a dense topic, I encourage you to dig into the referenced material (and their references) to get a more thorough understanding of LFIS. Accurately identifying, measuring, determining long range propagation of, and understanding exposure to LFIS from data centers, gas turbines, and other sources is critical to public health and safety.
Thanks to Roger Waxler and David Nelson.
References
[1] https://www.iea.org/reports/energy-and-ai/energy-supply-for-ai
[2] https://cleanview.co/reports/behind-the-meter-data-centers
[3] ANSI S12.9 Quantities and Procedures for Description and Measurement of Environmental Sound – Part 3: Short-term Measurements with an Observer Present, American National Standards Institute, Acoustical Society of America.
[4] Bray, Wade, “Relevance and applicability of the soundscape concept to physiological and behavioral effects caused by noise at very low frequencies which may not be audible”, J. Acoust. Soc. Am. 132, 1925 (2012)
[5] Woolworth, Waxler, Webster, “Evaluation of ANSI low frequency measurement standard S12.9 part 7 in light of current research”, Proceedings of Internoise 2024, Nante, France, August 2024.
[6] ANSI S12.9 Quantities and Procedures for Description and Measurement of Environmental Sound, Part 7 Measurement of Low-frequency Noise and Infrasound Outdoors and in the Presence of Wind and Indoors in Occupied Spaces standard, American National Standards Institute, Acoustical Society of America.
[7] Woolworth, Waxler, Webster, “Proposed method for characterizing wind turbine noise and their dependence on meteorological effects for validation of existing studies”, Proceedings of 5th international Conference on Wind Turbine Noise, August 2013.
[8] Jurado, Marquardt, “Infrasound sensation is mediated by intracochlear electrical potentials”, Springer Nature Scientific Reports (2026) 16:19097. also summary https://neurosciencenews.com/infrasound-noise-sensitivity-31024/
[9] Nelson, David, “Weighted-level method for forecasting community response to low-frequency noise”, Proceedings of Noise Con 2026, Long Beach, CA, July 2026.
About the author: David Woolworth is an acoustical consultant, educator, and researcher at Roland, Woolworth & Associates in Oxford, MS. An interest in low frequency community impacts was originally developed in response to managing entertainment sound and limits of standards and data addressing LFIS. Areas of research over the years include modal analysis of musical instruments, biomedical ultrasound, and other topics in physical acoustics. David is the chair of three ANSI standards S12.18, S12.9P7, S12.66, and is active in soundscape standards.