Insights into aircraft noise by doing continuously noise measurement around Amsterdam Schiphol Airport
By Maarten Meeuwes, researcher at M+P Consulting engineers
Amsterdam Schiphol Airport is a major airport located in the densely inhabited western part of Netherlands and is causing noise disturbance in the large population living there (see also accompanying paper in this magazine from van Blokland). Improvement of the living quality is expected from the large-scale fleet renewal scheduled in the coming decade that is driven by the higher fuel efficiency of the newest generation of aircraft. The noise emission data available for these aircrafts in Eurocontrol’s ANP database already indicate significant lower noise levels. To investigate if the expectations can be corroborated with empirical data M+P conducted an extensive study. Aircraft data and noise events of around 240.000 flyovers, both approaching and departing traffic, were recorded and analysed. Aircraft data included not only the aircraft type, but also engine type, several engine parameters and flight data made available from the Schiphol CASPER application.
How the aircraft noise measurements are conducted
Such amount of data can only be acquired by fully automated measurement systems. The flyover noise events were recorded with the unsupervised data acquisition system Yasmin developed by M+P (for more info see: Compliance of M+P software with acoustic standards). All incoming data were organized within the M+P developed LSSN sensor network. The Yasmin measurement system continuously sends 1 second of measurement data to the LSSN network. Apart from the direct noise data we also collected the flight data for each event. Only for this study the data were made available by air traffic control at Schiphol airport.
Measurements were performed at two locations around Schiphol Airport. Location 1 is positioned in Aalsmeer, directly under the approach path of the Aalsmeerbaan (runway 18L-36R) (and conveniently located at the premises of the M+P office). Location 2 is positioned near the Kaagbaan (runway 06-24). See Figure 1 for an overview. An example of the flight paths of the aircraft in relation to the measurement locations can be seen in Figure 2 and Figure 3.
Measurements of aircraft flyovers from and to the Aalsmeerbaan started in February 2023 and are ongoing. Measurements of aircraft flyovers from and to the Kaagbaan started in October 2022 and stopped in January 2024.
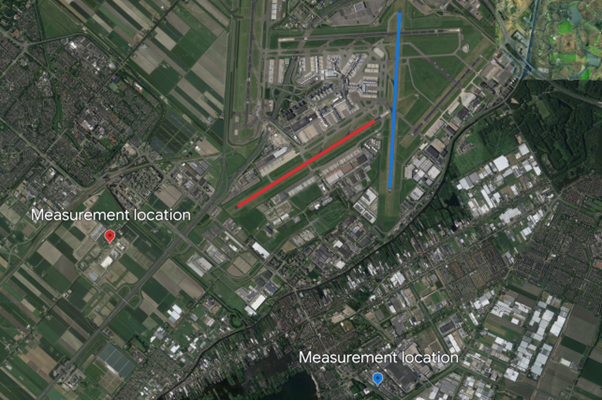
Figure 1: Overview measurement locations (Blue: Aalsmeerbaan, Red: Kaagbaan)
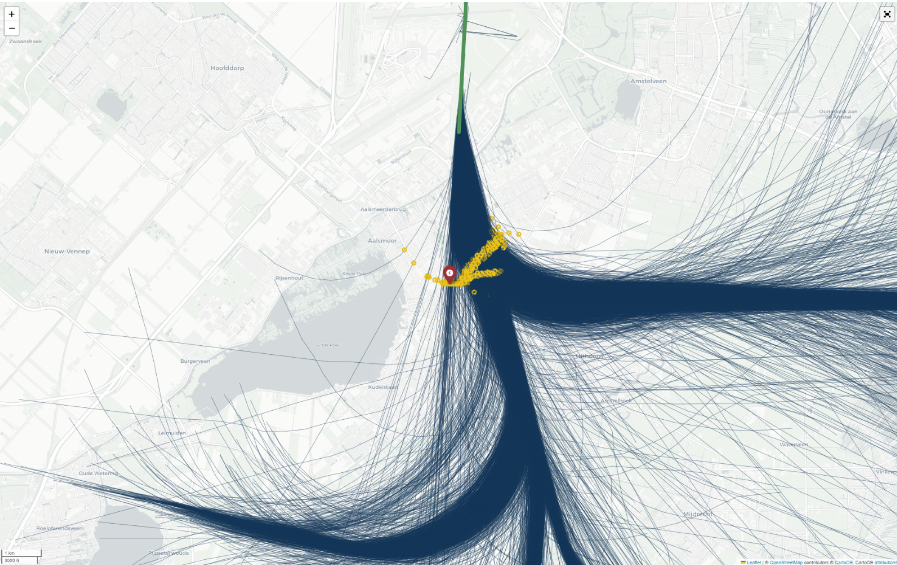
Figure 2: Overview of flight paths of aircraft departing from the Aalsmeerbaan. Red sign is location of measurement station
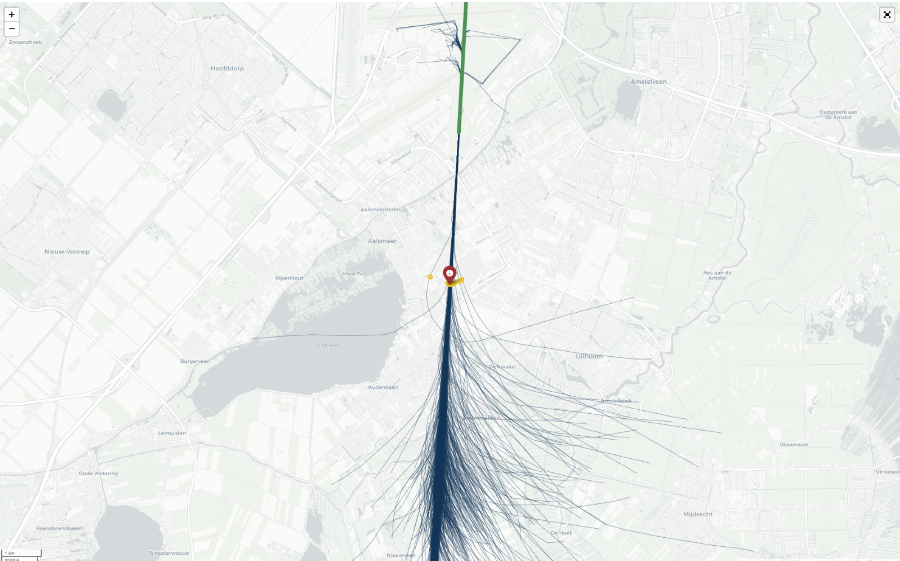
Figure 3: Overview of flight paths of aircraft approaching the Aalsmeerbaan. Red sign is location of measurement station
Processing (aircraft) noise measurements
In the next step for each flyover event the noise data coming from the M+P Yasmin measurement systems and collected within the M+P LSSN sensor network must be combined with the flight parameters made available by the Schiphol Air Traffic control. Figure 4 presents noise measurement data of approaching aircraft for the Aalsmeerbaan on a busy afternoon; each peak represents a flyover event.
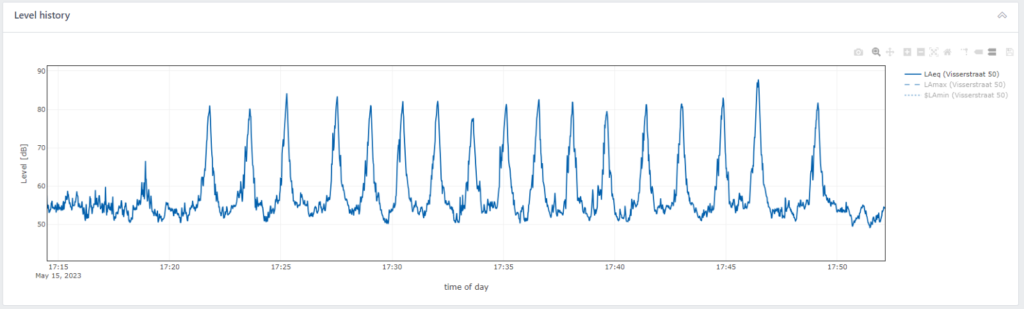
Figure 4: Example raw measurement data of approaching traffic on the Aalsmeerbaan
Of each event the SEL (Sound Exposure Level) is determined. To minimize the influence of background noise, the 10-dB down method has been employed for processing the data for each aircraft passage. This process is derived from the ISO-20906 standard. An example of this process can be seen in Figure 5.
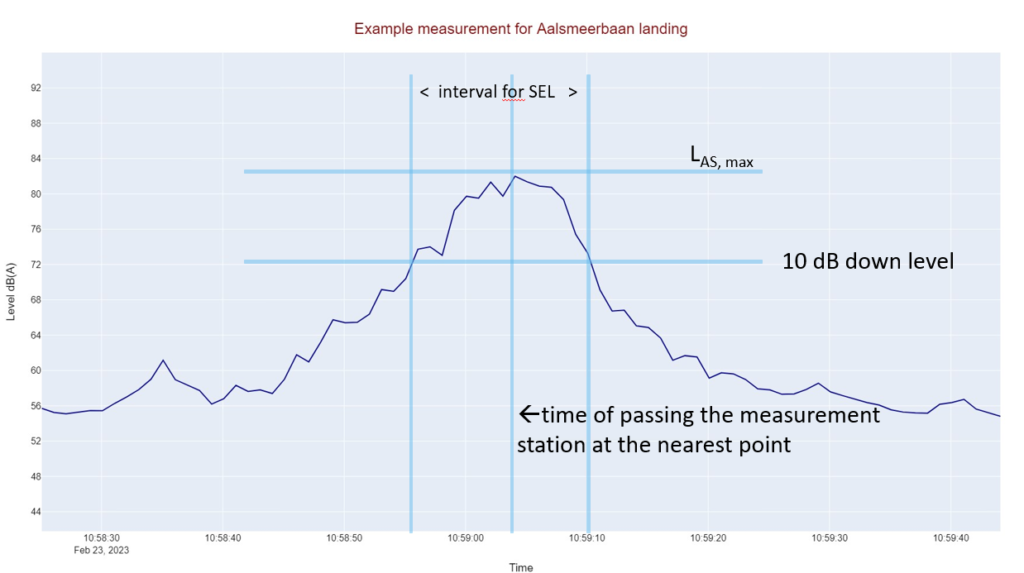
Figure 5: Example of noise data processing of a single flight event
By determining a time of passage for each flight, it is possible to correctly link the noise data to each flight parameter set. So far, it has been possible to link noise measurement data to flight parameters for approximately 240,000 events.
Develop insights based on processed aircraft noise measurements and flight parameters
SEL values as such do not provide particularly relevant insights. To generate meaningful understanding, more context must be provided alongside the SEL values. This is achieved by adding additional data about the flight. This ranges from the aircraft type, the engine type, the type of mixing to the bypass ratio of the engine. The content of four public data sources have been used for each flight:
- Aircraft Noise Performance (ANP) data base
- ICAO Aircraft Engine Emission data base
- CAPA Fleet data base
- Relevant weather data from the Netherlands Meteorological Institute KNMI
Based on the flight’s geometry, parameters such as the aircraft’s speed and altitude at the time of passage, the elevation angle between the measurement station and the aircraft, and based on the performance coefficients, an estimation of the thrust provided by the engine is determined.
Additionally, there are criteria that the event must meet to be included in the data set. There should not be too few or too many samples included in the SEL calculation. Measurements taken during rain are not included, nor are those taken during snow, thunderstorms, ice formation, or when the wind speed is > 10 m/s. Furthermore, the flight data must be complete and free of errors. Data from external sources may be absent, as this data may not be available for every aircraft type.
Insights into aircraft noise
The dataset includes a combination of take-offs and landings for both the Aalsmeerbaan and Kaagbaan. First in the data set the location and the type of operation was distinguished. The resulting noise data are presented in Figure 6. What is clearly noticeable is that the SELs per location and operation type vary greatly, but they roughly follow a normal distribution.
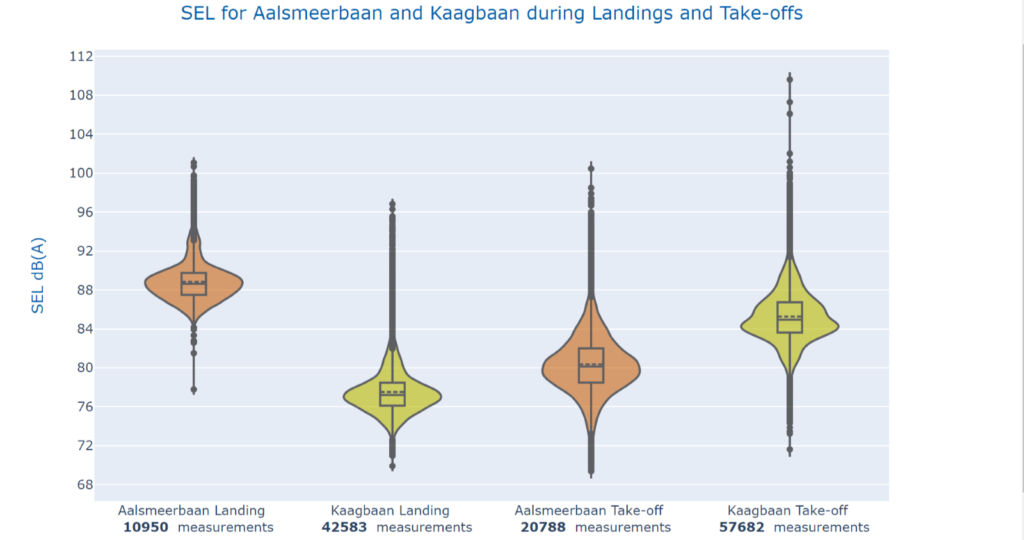
Figure 6: Violin plots with distribution of SELs per location and operation
The measuring station for the Aalsmeerbaan is positioned directly under the approach route so the lateral distances for arrivals are almost all around zero meters, and therefore the SELs are also higher. Departing flights from the Aalsmeerbaan are mainly heading eastbound, with the ‘initial turn’ located north-east of the measurement station (see Figure 2). This explains the lower SELs in relation to the arrivals. For the Kaagbaan the distance between the flight path and the measurement station is around the same for both approaches and take-offs.
Insights into aircraft noise per aircraft type
In Figure 7 the distribution over individual aircraft types is presented for Kaagbaan take-offs. The Boeing 747-400 (B744) is the aircraft type with the highest mean SEL, namely 93,4 dB(A). The B744 is also the noisiest for the landings and for landing and take-off from the Aalsmeerbaan. Furthermore, it can be seen that the wide-body aircraft lie in the left half of the plot and in general exhibit a higher mean SEL than the single-aisles. What further stands out in Figure 7 is that the newer generation wide-body aircraft such as Boeing 787-8/9 (B788/B789) or Airbus A350-900 (A359) have on average around the same or lower SELs than the current generation single-aisle aircraft. For the Airbus A350-900, the mean SEL is 84,5 dB(A), while for the frequently flown Boeing 737-800 (B738), it is 86,5 dB(A).
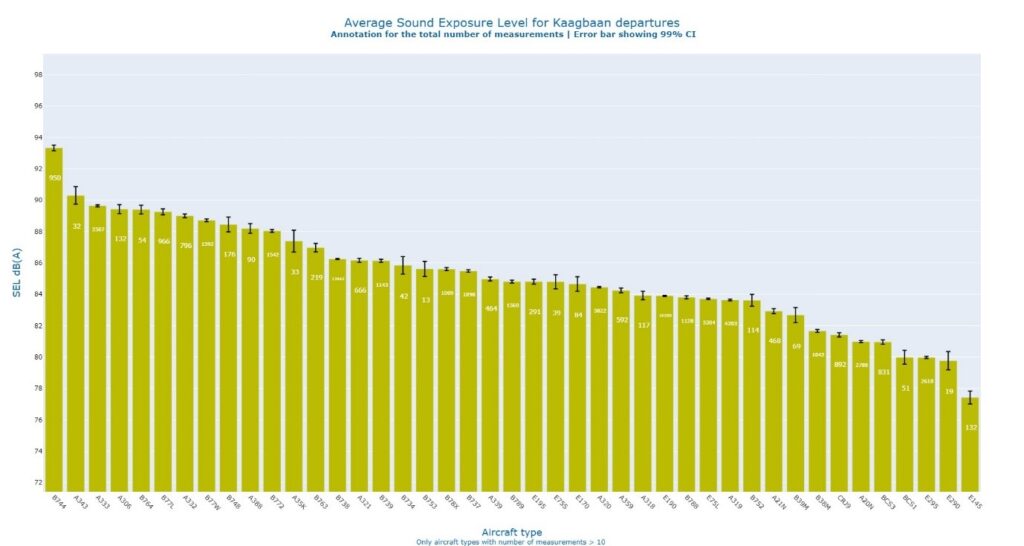
Figure 7: Average SEL values and 99% c.i around it for take-off from the Kaagbaan for different aircraft types
Fleet renewal at KLM and Transavia
KLM and Transavia, Schiphol Airport’s major users, are very active with a large-scale fleet renewal with the purchase of 100 to160 A320/A321 neo and 50 Airbus A350 to replace the current fleet of Boeing 737s and Airbus A330s.
Figure 8: Source: https://www.aviation24.be/airlines/air-france-klm-group/transavia/transavia-invests-in-noise-and-co2-reduction-with-airbus-a321neo/
From a noise perspective, we observe for the new A321neo aircraft type approximately 4 dB lower SEL levels during take-off compared to the current B737-800 used by Transavia. During landing, the A321neo is approximately 1.5 dB quieter. When comparing, it’s important to consider that the successors of certain types are not necessarily of the same size. For instance, the A321neo is larger than the B 737-800. Reductions in SEL levels of departing aircraft of the same size of up to approximately 5 dB are realistic.
Our measurements indicate that fleet renewal can make a significant contribution to reducing noise around airports. The extent to which noise reduction benefits the environment and affects the nuisance situation around the airport depends on many other parameters, such as the number of passages, the time of day they occur, and other sources relevant to the nuisance in the area.
Detailed analysis of engine specification influencing produced noise
Up to here the basis of distinguishing aircraft with respect to noise was the manufacture and type. Since the engine is the main source of noise emission, it is interesting to investigate the effect of engine type and character on the noise production. This is done on base of a subset of the measurement data with A320 NEO and A321 NEO. These types are equipped with either CFM56-LEAP or PW1100G engines. The results of distinguishing engine type are presented in Figure 9.
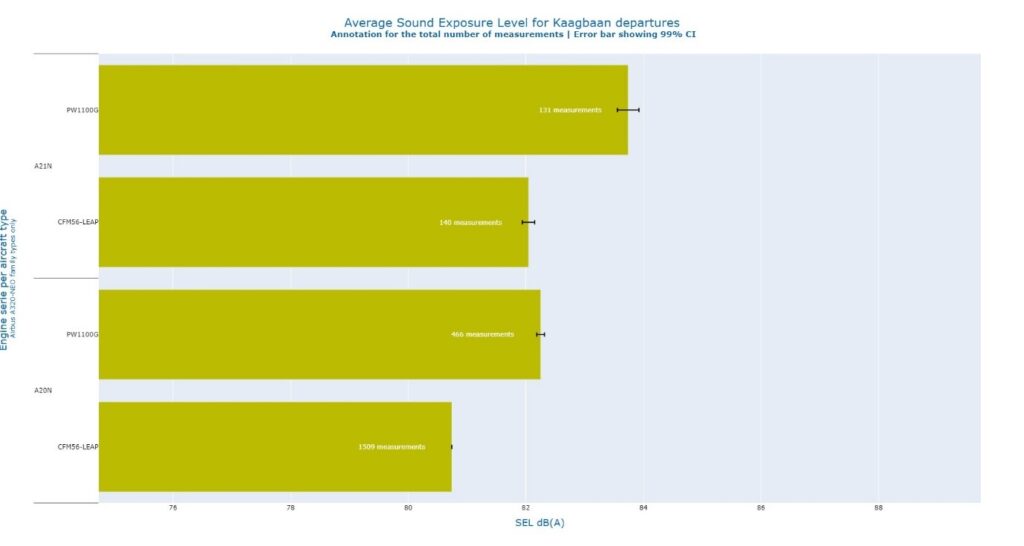
Figure 9: SEL levels for take-off from the Kaagbaan for A320 neo and A321 neo equipped with either a CFM or a PW engine.
What is clearly visible is that the type of engine does indeed influence the SELs and differences up to 2 dB are observed with the CFM56-LEAP being the less noisy one for both the A320 and A321 neo.
Within the engine types, also a difference can be made between Turbofan (TF) and Mixed Turbofan (MTF). It is assumed that MTF engines produce a lower noise level compared to TF engines, because the mixing of the two gas streams with strongly different velocities takes place within the engine and the noise emission from the resulting turbulences is shielded by the nacelle. In case of TF types the mixing takes place in the unshielded rear of the engine (for more info see: TF vs MTF). To verify this assumption, a look is taken at aircraft types that have both TF and MTF engines mounted. This is the case for the Airbus A319, A320 and A321, therefore these aircraft types are selected for further analysis.
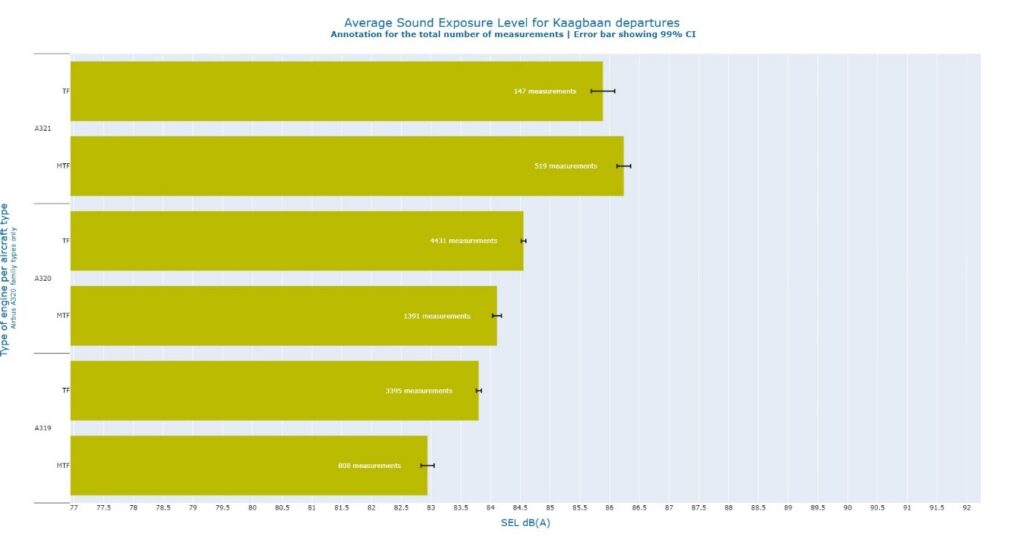
Figure 10: Average SEL for TF and MTF engines for Airbus A319, A320 and A321. Kaagbaan take-off
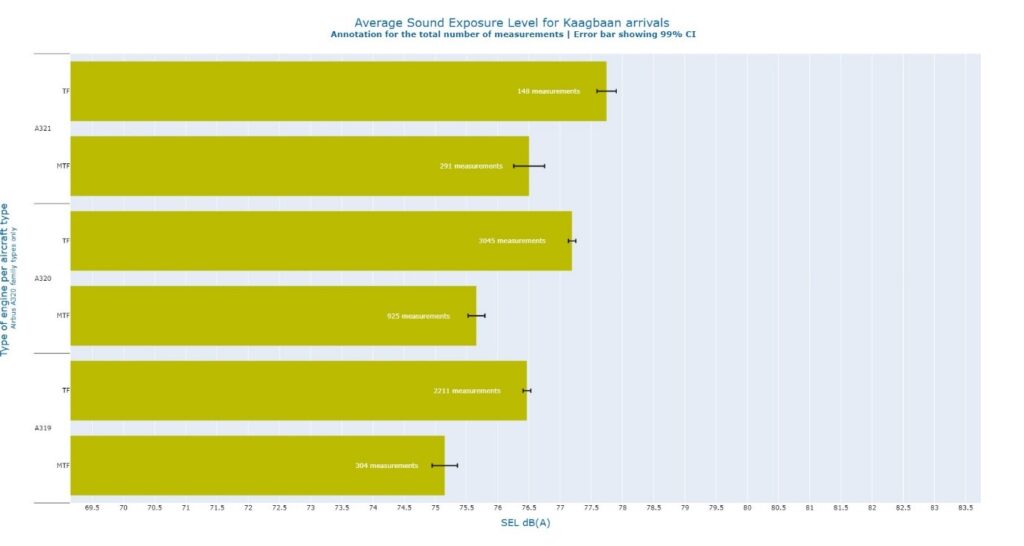
Figure 11: Average SEL for TF and MTF engines for Airbus A319, A320 and A321. Kaagbaan landing
In Figure 11 it can be seen that for Kaagbaan landings, there is indeed a difference between TF and MTF engines for all three aircraft types. This difference is less when looking at Kaagbaan take-offs in Figure 10 that shows that for the A321, there is no difference, and for the A319 and A320 the difference is smaller.
In addition, we investigated the relation between noise emission and some other aircraft and engine data. The results in Figure 12 show that there is a negative correlation between the bypass ratio and the SELs. The bypass ratio is a comparison between the mass flow rate of air drawn into the engine through the fan disk that goes around the engine core and the mass flow rate of the air that goes through the engine core (source: SKYbrary Bypass Ratio)
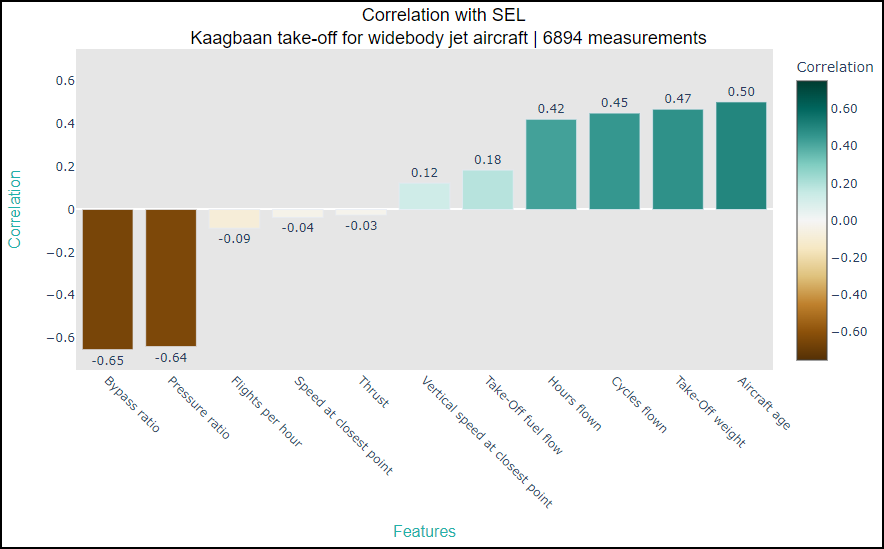
Figure 12: Correlation for Kaagbaan take-off, widebody aircraft only.
The negative correlation of -0.65 indicates a strong inverse relationship between the bypass ratio and the noise emission. As the bypass ratio of an engine rises, the SEL decreases.
Although the above results only pertain to the take-offs of wide-body aircraft on the Kaagbaan, the same negative correlation can be seen for all other combinations, i.e., take-offs, landings on both the Aalsmeerbaan and Kaagbaan, for regional, single-aisle jets and wide-body aircraft The same negative correlation applies to the pressure ratio, although this is strongly positive for landings of regional aircraft. Upon this time is it not clear why positive correlation is only present for landing regional aircraft.
The future of aircraft noise measurements at M+P
The interesting and very relevant area of aircraft noise is becoming a key topic at M+P. Currently, we are investigating whether it is possible to determine the contribution of each source within the aircraft to the produced noise using AI. Not only total A-weighted levels but also the spectral distribution of the acoustic energy is used for further understanding the nature of aircraft sound. Not only are we interested in making further steps but also to share our knowledge with the community. The possibility of an “aircraft noise view site” is being explored to share insights about aircraft noise in an accessible manner with interested parties.