Noise enforcement of a major airport, a balancing act
By Gijsjan van Blokland, Former member of the noise expert group for Amsterdam Schiphol Airport
Operating a major airport within an urban agglomeration while maintaining harmony with the people living nearby is not an easy task. The Amsterdam Schiphol Airport (AMS) has a history of almost 30 years of trying to maintain growth while at the same time improving the acoustic quality in the environment. The chart of the number of passengers and number of operations over the years, presented in Fig 1 shows that AMS was successful with the first part of the challenge.
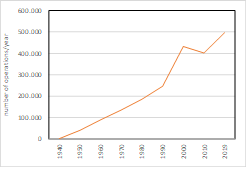
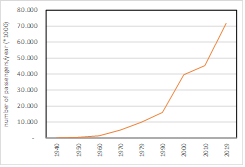
Figure 1: Development of the number of passengers and the number of operations on Amsterdam Schiphol Airport (AMS)
Maintaining the living quality for the people nearby, however, is a continuing struggle.
This paper sketches the development of procedures to limit the noise imission in the vicinity of the airport.
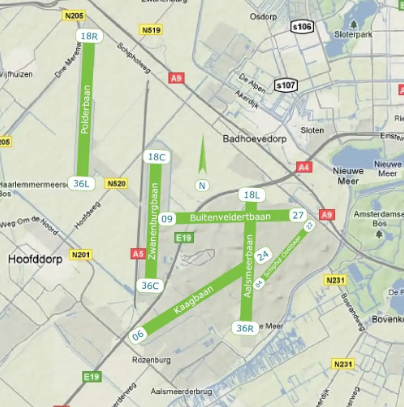
Figure 2: Lay-out of AMS. In 2000 runway 36L-18R was added. The smaller 04-22 runway is for general aviation only.
AMS is situated in the south-west of Amsterdam and is surrounded by several larger and smaller cities and villages. To facilitate operations under varying wind conditions it had four runways, one in E-W (09-27), two in N-S (18C-36C and 18L-36R) and one in SW-NE (06-24) orientation (see Fig 2).
Development started when in 1995 a closed not-to-exceed contour at 35 Ke noise level, comprising 15.100 houses, was defined around the four runways of the airport (Fig 3 Left). The Ke measure used is a kind of energy-based cumulation of LAmax levels over a year with a penalty for evening and night events and noisier events. For the night period a separate 26 dB LAeq (level inside bedroom) zone was drawn. In 2000 a fifth runway was added that was carefully aligned so that arriving and departing traffic could avoid urban areas in the north of the airport. Traffic in the south was not allowed. Consequently, the noise target in terms of houses within the new, not-to-exceed contour of 35 Ke could be reduced to 10.000. Comments that such a continuous contour not only limits noise exposure of inhabitants but also of cows in meadows and vehicles in parking lots were addressed by replacing the contour by a chain of enforcement points located near living areas (see Fig 3 Right). The table presents the coordinates and the not-to-exceed level without and with a 1 dB margin for extraordinary weather conditions.
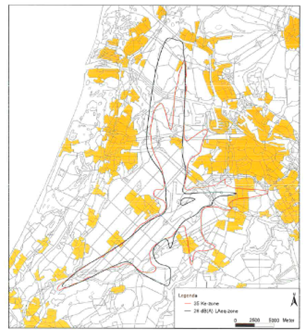
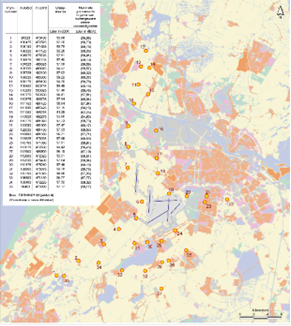
Figure 3: Enforcement geography. Left: in black the continuous not-to-exceed 35 Ke contour around the original 4 runway system (the red contour presents the additional Lnight contour). Right: the 35 enforcement points, also roughly on a 35 ke contour, but defined in dB Lden.
How to construct a not-to-exceed noise contour or series of limit values
One cannot just map all traffic within a year, including aircraft type, time of day and approach or departure protocols and put that in the noise model. This contour would fit for that specific year but will not fit next year’s traffic since another wind regime or shifted origin/destinations leads to another distribution over the runways.
The construction of the contour was done by defining a typical traffic ensemble with timetable, aircraft types and origin/destinations. The distribution of this traffic over runways was modelled using flight rules such as maximal allowable tail- and side wind speeds, gusts, other safety considerations and a preference for the 18L-36R and 06-24 runway since these generate less annoyance. The wind input was based on an average of the weather over 30 years. To allow for variations in runway use due to meteorological conditions deviating from the mean, the number of operations from each runway was increased by an average of 25%.
The noise exposure in the vicinity was then determined with the typical traffic ensemble, the runway distribution including the enlargement by about 25%, the standard flight routes and standard arrival or departure procedures used in 2002.
A chain of 35 enforcement points were selected around the airport, each in the vicinity of living areas. For each point, the calculated noise level in Lden served as a not-to-exceed level. However, if one can argue that the violation of the limit was caused by extra-ordinary weather, a margin of 1 dB was tolerated. The coordinates and limit values (with 1 dB extra-ordinary weather margin in brackets) for each point are presented in Fig 3 Right. To prevent “filling-up” of the enlarged contour also the total noise production of the traffic was capped based on the original traffic without the 25% increment.
The “AMS noise constitution”
Together with implementation in 2004 of the noise permit for AMS comprising this enforcement system, a kind of constitution was formulated that stipulated that every future enforcement system shall guarantee an equal or better acoustic quality for the people living around the airport than the one implemented in 2004. The general term “acoustic quality” was specified as a maximum number of houses within 58 dB Lden contour, a maximum number of highly annoyed people within the 48 dB Lden contour and similar constraints for the 48 and 40 dB Lnight contour. Whatever you modify in the structure of the enforcement system, it shall always comply with these figures (see Table 1).
| Houses within 58 dB Lden contour | 12.300 |
| Highly annoyed within 48 dB Lden contour | 239.500 |
| Houses within 48 dB Lnight contour | 11.700 |
| Highly sleep disturbed with 40 dB Lnight contour | 66.500 |
Was everybody happy? Not particularly
Soon after the introduction a most intense discussion was raised about the system of fixed enforcement locations with fixed not-to-exceed levels. It was experienced that over the years, in some locations, persistent violation of the limit values occurred while the actual levels on several other locations were far below the maximal levels. Large margins were found for enforcement points in the north, especially around the newly built fifth runway while in the south limits were often exceeded. For a well-designed system the margin should be on average about 1 dB and evenly distributed over the enforcement points. The conclusion was that the intended amount of traffic could not be handled within the designed limit values.
The systematic deviations between expected and actual values could be traced back to developments in air traffic control. Essential for the noise levels in enforcement points is the distribution of traffic over the runways. The limit values were based on runway usage steered by strict interpretation of ATC rules on allowed meteo-conditions, mainly sight, wind speed, wind direction and wind gusts. In practice, ATC operates on the safe side and in case of severe weather redirects traffic to safer but less noise preferent runways earlier. The on average 25% margin in runway usage was not enough to compensate for this effect.
Another issue was that the system of fixed levels made it hard to use the advantages of less noisy aircraft to expand operations. Limits in the capacity of the noise preferent runways, especially 18R-36L, hampered the filling up of the available acoustic room round that runway with more flights and only limited shifting to less noise preferent runways, such as 18L-36R, was possible because of the tight acoustic space available for that runway within the fixed limit values.
AMS convinced the authorities to develop a new, more flexible system.
Outline of the new enforcement system
The starting point for the new system was that it shall comply with the boundary conditions given in Table 1 and that it maintains the preferences for the “environmental friendly” runways 18L-36R and 06-24 but without a system of fixed points and fixed limits.
The easy solution would be to take the numbers from Table 1, reduce them with 20% and apply a yearly check that these reduced numbers are not exceeded. This option was studied but found to be too restrictive for the development of the airport.
A system was constructed in which the original process was followed but then on a yearly basis with a more reliable runway distribution model and a more precise modeling of the contour variations due to the variation in meteorological conditions.
The runway distribution model was developed based on a detailed correlation between 10 min. meteorological data and runway usage over a period of a few years. It considers parameters like frequency of landing or take-off (in busy times two runways for arrival or for departure will be in operation simultaneously and for short periods even two arrivals together with two departure runways) and origins/destination so that eastbound and westbound traffic on parallel runways will not cross each other.
With this improved model the runway distribution for the scheduled traffic for the coming year was to be reconstructed for each meteorological condition found in the last 40 years. That is, for every year the meteorological conditions were cut in 10 minutes interval for the whole year (52,000 intervals) and for each of these intervals the choice of runway was modelled, taking into account the listed parameters. From runway choice and origin/destination the routes can be reconstructed and after applying the existing arrival/departure procedures the noise map was calculated and from it the 58 Lden contour and the others mentioned in Table 1. To reconstruct a full equivalent of the original approach to correct for the effect of yearly meteorological variations, originally taken into account by the 25% increment in runway usage, an enveloping contour around the 40 individual yearly contours (see Fig 4) was drawn. (It was more complex since from this 40-year period 8 years were considered as having an exceptional meteorological situation and those years were not included in the construction of the enveloping contour).
The enveloping contours for 48 and 58 Lden and 40 and 48 Lnight were then subjected to the boundary conditions in Table 1.
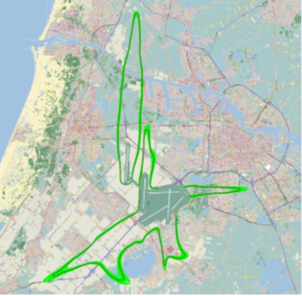
Figure 4: 58Lden contour around AMS. Traffic 2012 (434.500 operations). The dark drawn curve presents the contour in a year with average weather, the light green curves the Lden58 contours due to weather variation over 40 individual years (1971-2010) (Source to70).
Enforcement was performed as follows. The anticipated flight schedule for a coming year is subjected to the procedure sketched above, meaning runway distribution and routes are modelled and contours for 32 meteo years are calculated. Next the number of houses in the enveloping 58Lden contour are calculated (together with the appropriate figures for the 48dB Lden, and 40 and 48 Lnight enveloping contours). If the numbers comply with Table 1 then the planned flight schedule is approved. If not, the number of flights is reduced until it fits. The enforcement of the noise emission is now reduced to establishing the total sound emission that is produced by the allowed flight schedule and monitoring that this total emission is not exceeded over the operational year. Also, a check is performed to see if the runway usage did comply with the rules for noise preferences.
Difference between old and new system
There are many differences in procedure but, in the old system there was a fixed boundary. Inside the chain of enforcement points the airport could exceed the limit values, outside the chain of points the noise levels are limited.
In the new procedure such geographical fixation does not exist anymore. The contours may lie everywhere if the boundary conditions listed in Table 1 are met. This allows more flexible operations of the airport. The consequence of the improved flexibility is that the environment is less certain about what noise levels to expect in the coming years. For instance, the large acoustic margin that was available in the former system north of 36L-18R can now be used to intensify the flight operations on 36R-18L at the cost of the inhabitants of the village of Aalsmeer.
How does it work in practice, well…. Not.
The introduction of the new noise enforcement system has been delayed by several years because of another environmental issue, the deposition of NOX in nature areas around AMS. The Netherlands operates an oversized livestock industry that contributes significantly to already nature threatening levels of NOX. The permit for NOX immission by the airport was outdated and renewing implied compensation by NOX reductions elsewhere and these are hard to find.
The case now is that the former, but on paper still valid, noise enforcement system was already omitted while the new enforcement system cannot be implemented due to this NOX issue. So presently AMS operates with no valid noise enforcement system. An attempt by the authorities to reduce the number of operations as to comply with the still valid system with fixed points was found to be violating the EC regulation 2014/598 “Rules and procedures with regard to the introduction of noise-related operating restrictions at Union airports”.
In short, noise enforcement of Amsterdam Schiphol Airport has developed from a complex project performed by acousticians and flight controllers to a legal battlefield where lawyers take over the job of regulators and judges decide on boundaries. Noise enforcement for this airport represents an interesting case.
Acknowledgement
The developments of the consecutive enforcement systems were based on work by the NLR-Netherlands Aerospace Centre and to 70 Air traffic Consultants performed for the Dutch Ministry of Transport and Environment.