The Importance of L0w Lden Levels in the Number of People Highly Annoyed by Aviation Noise
By Nico van Oosten, Anotec Engineering, S.L., 18600 Motril (Granada), Spain, nico@anotecengineering.com
One of the main deliverables of the H2020 ANIMA project (2017-2020) was the definition and update of a common strategic research roadmap for aviation noise reduction, involving all key aspects related to mitigation solutions, assessment of noise effects on populations, and community engagement. To support this work, a toolchain was developed with which a variety of noise reduction scenarios could be assessed to provide a complete overview of the effect of the planned research and its possibilities of achieving the goals set by ACARE from the standpoint of environmental constraints [Ref. 1].
This toolchain was also used in the PHENOMENA study, performed in 2021 for DG-ENV, with the aim to assess the potential health benefits of noise mitigation measures in Europe [Ref. 2].
The toolchain used is built around SONDEO, an ECAC Doc29-compliant airport noise model, developed by ANOTEC for research and policy support studies [Ref.3]. The main characteristics of the toolchain are:
- Definition of two baseline aircraft platforms, representative for the short-medium range single aisle and long-range twin aircraft representative for the year 2000 technology (i.e., A320/A330 classic classes respectively). A spectral noise source database was developed for both platforms to be able to introduce noise reduction measures to various noise sources (jet, fan, airframe).
- Replacement of the actual fleet operating at 10 airports in Europe1 by an equivalent fleet, consisting of the above two baseline platforms. To this end, the number of operations of the two baseline platforms were adjusted such that the total noise contours of both actual and equivalent fleets match as good as possible.
- Determination of the noise impact for a range of indicators, from total contour area to number of people exposed to a range of Lden and Lnight levels and calculation of the corresponding number of people Highly Annoyed (HA) and Highly Sleep Disturbed (HSD). The range of levels was extended downwards to 45 and 40 dB(A) for Lden and Lnight, respectively.
- Scaling up of the results for 10 airports to all 60+ EU27 airports covered by the Environmental Noise Directive (END) [Ref.4]. In this scaling process, the results of the 2017 round of END strategic noise mapping have been used for validation.
The above-mentioned projects were directed towards calculating the effect of noise mitigation measures introduced in the aircraft, engines, and their operations. The benefits of such measures were expressed as a percentage of change with respect to a baseline case.
The first step in the process was therefore to establish the noise impact for the baseline case, for which the traffic for the year 2017 was used, as for this year the number of operations at all airports was known from the END results and the validation of the methodology was performed. Whereas for the mentioned studies this was just the starting point of further work, some of the results, however, already reveal an interesting situation, worth analyzing in some more detail.
The following table gives the resulting population distribution for the baseline case, for the various Lden level classes (see Table 1).
Table 1: distribution of noise exposure levels for population within 45 dB Lden END contours around European Airports
| Lden | ||||||
| 45-49 | 50-54 | 55-59 | 60-64 | 65-69 | 70-74 | ≥75 |
| 53.3% | 30.0% | 12.5% | 3.5% | 0.6% | 0.1% | 0.0% |
The END requires the determination of the number of people exposed to Lden levels above 55 dB(A). When dividing the population exposed into “non-END covered” (i.e., lower than this threshold) and “END covered” the following results are obtained (see figure 1).
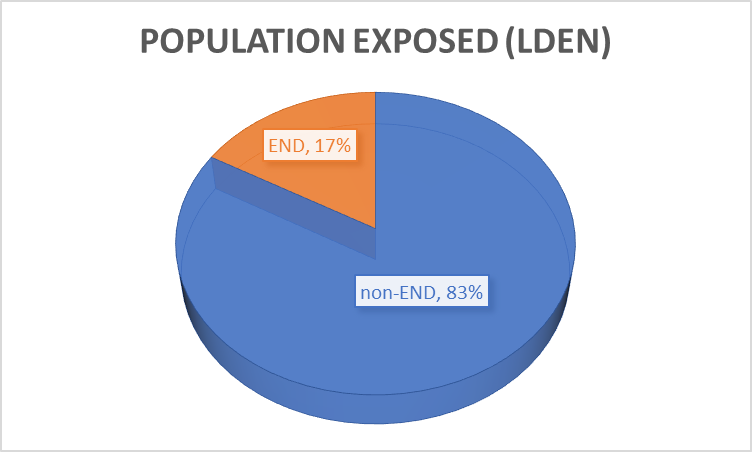
Figure 1: Fraction of population within 45 dB Lden END contours around European Airports that is included (END) and is not included in END reporting (non-END)
It can clearly be seen that only a relatively small part of the population exposed to aviation noise (<20%) is covered by the END. In simple terms, this means that relatively few people are exposed to higher noise levels, and many people to lower noise levels. Obviously, the exposure to higher noise levels results in more harmful effects, but as fewer people are exposed, how does the combinations look like?
The formulas for the harmful effects of aviation noise, mentioned in Annex III to the END, provide the percentage of people Highly Annoyed (HA) as a function of Lden:
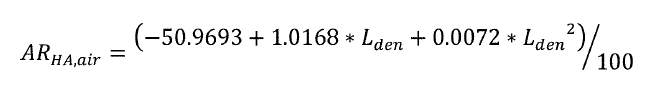
When considering a hypothetical population of four million people exposed to noise levels above Lden 45 dB(A), the following results are obtained (see Table 2).
Table 2: Number of people exposed and highly annoyed (HA) in corresponding Lden classes for European airports covered by the END
| Lden | |||||||
| 45-49 | 50-54 | 55-59 | 60-64 | 65-69 | 70-74 | ≥75 | |
| No people | 2,133,333 | 1,200,000 | 500,288 | 139,778 | 22,464 | 4,015 | 121 |
| AR | 13.6% | 22.3% | 31.3% | 40.7% | 50.5% | 60.6% | 71.1% |
| HA | 289,572 | 267,092 | 156,599 | 56,898 | 11,338 | 2,433 | 86 |
| % pop | 36.9% | 34.1% | 20.0% | 7.3% | 1.4% | 0.3% | 0.0% |
Where:
- Nº people, absolute number of people in the corresponding Lden class
- AR, the % of people HA for the Lden class, based on the formula of Annex III
- HA, the absolute number of people Highly Annoyed (=Nº of people x AR)
- %pop, the relative contribution of the Lden class to the total number of people Highly Annoyed
When we again group according to “non-END” and “END,” we obtain the following result (see figure 2).
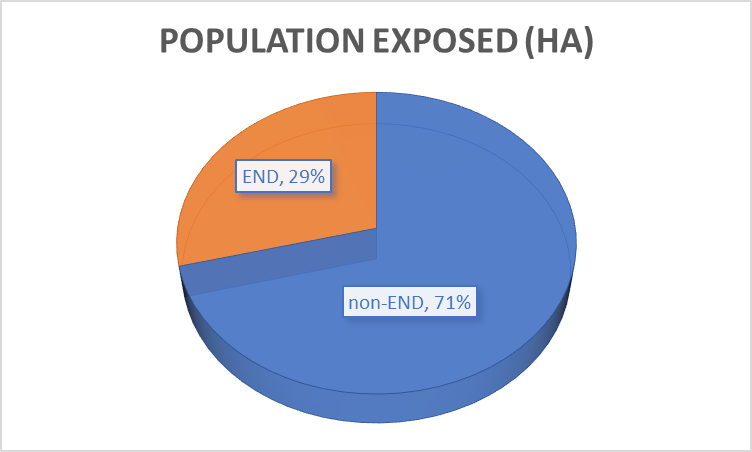
Figure 2: Fraction of Highly Annoyed population within 45 dB Lden END contours around European Airports that is included (END) and is not included in END reporting (non-END).
From this, it can be concluded that considering the harmful effect (Highly Annoyed), the large amount of population exposed to lower noise levels “wins” from the small amount of people exposed to higher noise levels.
It is recognized that the prediction of the number of people exposed to lower noise levels comes with challenges with respect to its accuracy for various reasons (a.o. noise predictions less accurate due to e.g. long propagation distances, exact position of aircraft unknown at large distances from airport (direct routing above certain altitudes), etc.). Nevertheless, the difference between both groups “non-END” and “END” is so big, that even this inaccuracy is unlikely to change the general trend observed.
Until now, most efforts to reduce the noise exposure to aviation noise has been directed towards the reduction of the number of people exposed to high noise levels. If, however, the main goal of the noise policy shifts towards noise impact, i.e., minimizing the number of people Highly Annoyed and Highly Sleep Disturbed, it is recommended to broaden the geographical scope, by considering the areas where lower noise levels are expected.
[1] Amsterdam, Frankfurt, Copenhagen, Vienna, Dublin, Palma de Mallorca, Lisbon, Cologne, Budapest, Gothenburg
References:
- “Towards mapping of noise impact”, Ferenc Marki , Peter Rucz , Nico van Oosten, Emir Ganic and Ingrid Legriffon, https://www.academia.edu/116167922/Towards_Mapping_of_Noise_Impact
- “Assessment of Potential Health Benefits of Noise Abatement Measures in the European Union: Phenomena “, Michael Dittrich e.a., NNI, June 2021
- “SONDEO: A new tool for airport noise assessment,” Nico van Oosten, InterNoise 2004
- “Assessment and management of environmental noise “, Directive 2002/49/EC, incl. Am.6, 2021