How Energy Relations Explain Vibration Behavior
By Eric E. Ungar
Acentech, Inc., Cambridge, MA
Much can be learned about why vibrating systems behave the way they do by considering the energy associated with vibrations and by studying its implications with the aid of phase plane curves. Such curves represent the relation between the velocity and the displacement of a simple spring-mass model, which may represent a mode of a vibrating system or structure. It is on this model that the following discussion is based.
Energy Exchange in Free Vibration
Let us look at the classical vibrating system consisting of a mass m supported on a linear spring with spring constant k. The total energy WT in such a system consists of the kinetic energy Wm “stored” in the mass and the potential energy WS stored in the spring. If the spring at a given instant is deflected an amount x from its static equilibrium position and the mass moves with a velocity v, then
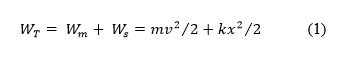
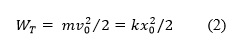
In absence of damping, the total energy remains constant as the system vibrates, and there occurs an interchange between the kinetic and potential energies. The greatest velocity v0 then occurs at the instant at which the displacement is zero, and the greatest displacement x0 results when the velocity is zero. If there is no loss of energy, then
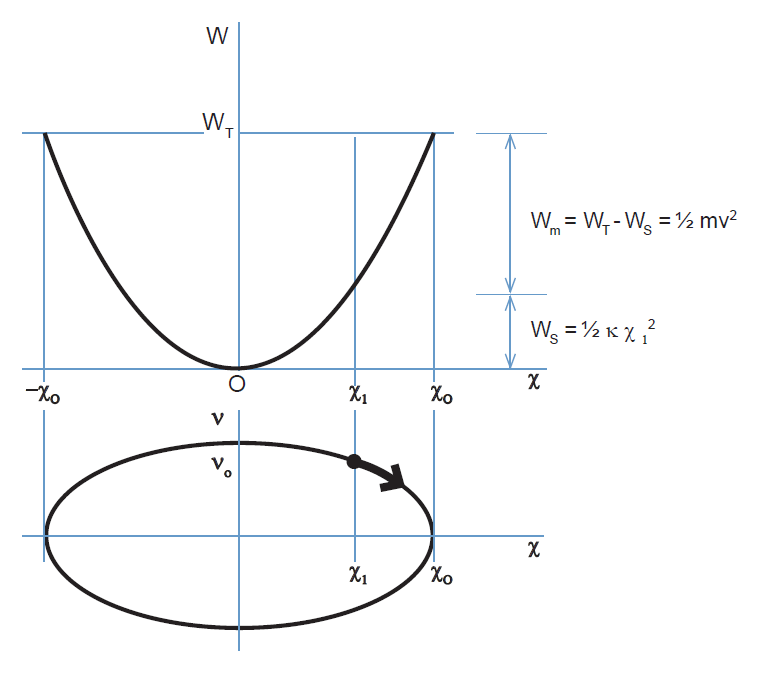
The upper part of the diagram of figure 1 is a convenient visualization of these relations. It shows a parabolic curve that represents the dependence of WS on the displacement x and indicates the partition of total energy into its potential and kinetic energy components.
Phase Plane
The lower part of figure 1 is an elliptical curve that shows the variation of velocity with displacement implied by the energy relation of equation (1) that is represented by the upper part of the figure. One may readily visualize that a point representing the system’s status moves along the curve of this “phase plane” plot as a vibration progresses.
For a system with a linear spring (whose deflection is proportional to the force applied to it), the aforementioned curves are true parabolas and ellipses. For springs with other types of force-deflection characteristics, or in the presence of other forces, such as gravitational and magnetic ones, one obtains diagrams similar to figure 1, but the curves take on somewhat different shapes.
For example, a phase plane plot corresponding to a mass bouncing across a gap between two springs essentially consists of two half ellipses (one on the left and one on the right) connected by horizontal constant velocity lines extending over the length of the gap. A phase plane plot corresponding to a mass supported on a spring whose stiffness increases with increasing deflection (perhaps representing a rubber element) will have the shape of a distorted ellipse with a positive maximum displacement whose magnitude is smaller than that of the greatest negative displacement.
Why Constant Natural Frequency?
By considering movement of a point that represents the state of the system along a phase plane curve, one may readily understand why a vibrating system’s time to complete a cycle of vibration remains constant or, equivalently, why it has a constant natural frequency. Since the velocity corresponding to any particular deflection determines the time required for the incremental change in the displacement, the time required for moving from a given displacement to the next is always the same. This also holds for the time it takes for completion of a cycle (a phase plane point’s complete round-trip)—that is, for the period of the oscillation.
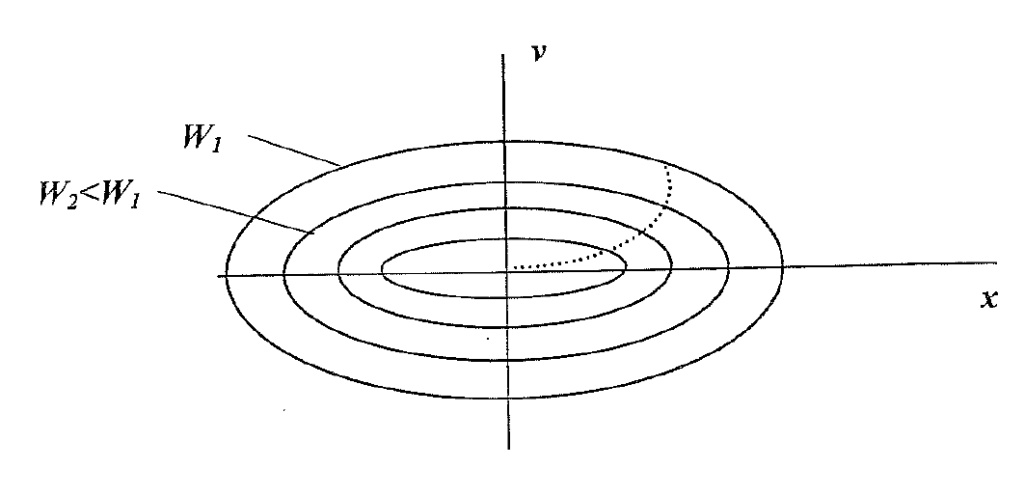
In vibrations with smaller vibration energies, the greatest deflections, as well as the greatest velocities, are smaller, so that smaller vibrations are represented by smaller ellipses (see fig. 2). In such a vibration, the velocity associated with a given deflection is smaller, and the time it takes to traverse an increment of displacement is longer, but the phase plane point has a shorter total distance to cover, leading one to expect that the period T and the natural frequency are independent of the total energy of vibration. This may not be intuitively obvious, but can be verified mathematically.
Free Vibrations with Damping
Since damping produces an energy loss and smaller energies correspond to smaller ellipses, a point in the phase plane representing a decaying vibration moves toward the origin along a spiral-shaped path. With small damping the spiral is tight, with greater damping the spiraling toward the origin is more rapid, and with extremely high damping, one may expect a curtailed spiral path like that of the dotted curve of figure 2, representing a non-oscillatory drifting to zero deflection.
Recall that viscous damping is proportional to velocity, and note that as a point moves along an elliptical (or nearly elliptical) phase plane curve, it is at the greatest (absolute) velocity, as well as at zero velocity, twice per cycle. Thus, one would expect the energy not to decay smoothly but with twice per cycle fluctuations—that is, with fluctuations at twice the natural frequency. Indeed, a mathematically derived plot of the time-variation of the energy magnitude shows fluctuations about the “average” exponential decay at twice the natural frequency.
Concluding Remarks
The foregoing discussion has presented some introductory insights one may obtain from phase plane analyses. However, much more can be learned from such analyses. Phase plane relations have, in fact, been used extensively to study the motions of nonlinear systems. See, for example, the classic Nonlinear Vibrations in Mechanical and Electrical Systems, by J. J. Stoker (Interscience Publishers, first published in 1950); and “Nonlinear Vibrations,” chapter 12 of Theory of Vibration with Applications, by W. T. Thomson (Prentice-Hall, Inc., 1981).