Predict, Don’t Repair – Prediction-Based Noise Control in Industrial Halls
Introduction
In many industrial sectors (e.g., bottling/packaging, metalworking, woodworking, logistics), noise at machine workstations often reaches critical ranges. In many of these applications, sound is generated by mechanical excitation and vibration-related radiation, for example when bottles collide and vibrate in bottling lines or when machine surfaces and moving components radiate sound. Besides direct sound from dominant sources, industrial halls typically exhibit a highly reverberant, partly diffuse sound field. Without absorption, elevated and relatively uniform levels may develop across large areas, with additional hot spots close to individual machines. Noise control addresses different parts of this problem: baffle ceilings/wall absorbers reduce the diffuse component, enclosures reduce source group emission, and barriers provide local shielding at workstations. However, the most effective combination and the resulting change in workplace exposure cannot usually be derived from measurements alone. Prediction-based methods enable systematic variant comparisons in design and retrofit (“Predict, don’t repair”).
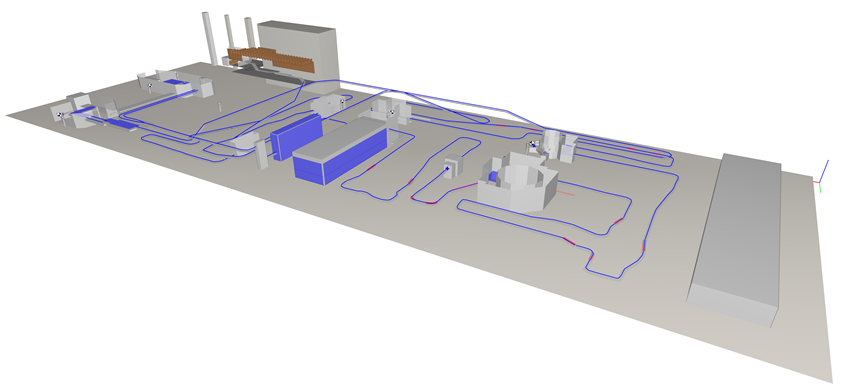
Figure 1: 3D model of the bottling line used for prediction-based assessment
Workplace Noise Targets
Across countries, occupational noise control aims to assess and document exposure and derive effective measures. While limits and action levels differ by region, decisions are typically based on time-averaged exposure (e.g., 8 h) and the consideration of peak/impulsive events. The table below provides widely used reference values (EU/USA) for orientation.
Table 1: Occupational noise exposure reference thresholds (EU/USA)
| Region / standard | Reference / criterion | Permissible exposure (8 h) | Peak / impulse |
| USA (OSHA 29 CFR 1910.95) [1] | 85 dB(A) TWA* (Action Level for Hearing Conservation) | 90 dB(A) TWA (PEL**) | 140 dB peak (impulse/impact noise should not be exceeded) |
| USA (NIOSH recommendation) [2] | 85 dB(A) TWA (REL***) | 85 dB(A) TWA (REL, 3-dB exchange rate) | 140 dB peak (ceiling recommendation) |
| EU (Directive 2003/10/EC) [3] | 80 dB(A) (Lower Exposure Action Value) / 85 dB(A) (Upper Exposure Action Value) | 87 dB(A) (Exposure Limit Value, taking hearing protection attenuation into account) | 135 / 137 / 140 dB(C) peak (Lower/Upper Action Value / Limit Value) |
* TWA = Time Weighted Average; ** PEL = Permissible Exposure Limit; *** REL = Recommended Exposure Limit
Why Prediction Matters
Baseline measurements are indispensable, but they only describe the current situation. Without prediction, it often remains unclear which measure will actually be effective—frequently leading in practice to over-dimensioned solutions, uncertainty about the achievable reduction in workplace exposure, and retrofit concepts that can only be implemented to a limited extent due to structural constraints. Especially in existing plants, measures may no longer be feasible or only at considerable effort, for example when baffle ceilings cannot be integrated because of existing structures, pipework/cable routing, or crane runways, making costly modifications necessary. Prediction provides planning certainty, particularly for (1) planning new plants or layout changes and (2) optimising existing plants through systematic variant comparison—supported by robust input data and calibrated machine/source group models for reproducible assessments.
For the prediction calculations, CadnaR [4] was used as a software tool quality-assured for this application according to DIN 38457:2025-05 [5].
Case Study 1: Planning a Bottling Line
Prediction supports early identification of noise-intensive areas, workstation placement, and variant comparison before investments are made. In bottling lines, such noise-intensive areas can result from mechanically excited product flows, for example where bottles collide, accumulate, or are guided through regulating sections. In the example shown, a baffle ceiling is evaluated using baseline, variant and difference maps. Evaluation metric: The predictions are evaluated using A-weighted workplace sound pressure levels at selected operator positions and grid-based level maps to visualise the spatial distribution and the effect of the measure.
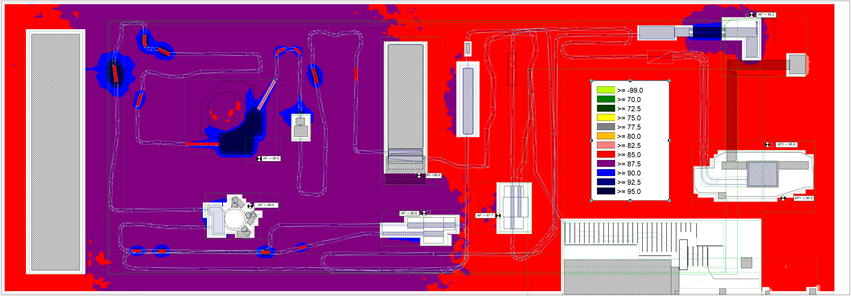
Figure 2: Baseline A-weighted level map of the bottling line (no acoustic treatment), highlighting high-level zones and local hot spots near dominant machines.

Figure 3: Variant A-weighted level map with baffle ceiling, showing reduced levels over larger areas due to a lower diffuse sound field component.
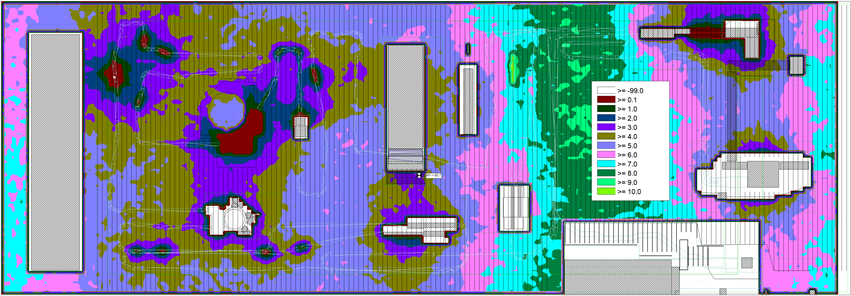
Figure 4: Difference map (baseline – baffle ceiling variant), visualising the spatial effect of the ceiling treatment (ΔLp, grid arithmetic).
Case Study 2: Retrofitting a Cleaning Station
In existing plants, noise control is often driven by measured exceedances at specific workstations. While measurements are essential to characterise the current situation, they do not directly indicate which retrofit measure will be most effective once installed. Prediction enables a targeted variant comparison under real geometric and operational constraints, helping to avoid over-dimensioned solutions and costly rework. In the example presented here, a local noise barrier at a cleaning machine is used to modify radiation and provide shielding at nearby operator positions. Results are reported as A-weighted workplace sound pressure levels (LpA) at the operator position.
Noise barrier at the cleaning machine (sliding barrier open vs. closed)
Near-field measurements were used to calibrate a source model of the cleaning machine. A local barrier was evaluated in a free-field setup and then assessed in the full plant model (including room response and other sources). The barrier is open during manual intervention when bottles are aligned into the cleaning machine infeed lanes.
Table 2: Case Study 2 – barrier open vs. closed (free-field and in-plant). In-plant reduction at operator position: >5 dB.
| barrier open | barrier closed |
| Free-field simulation: LpA = 90.3 dB(A) | Free-field simulation: LpA = 82.1 dB(A) |
| In-plant simulation: LpA = 91.0 dB(A) | In-plant simulation: LpA = 85.6 dB(A) |
In addition to barriers, which mainly influence the directionality of the radiated sound energy, complete enclosures can also be modelled, including their sound insulation performance (transmission loss) and the absorption inside the enclosure. In this case, the measure does not only change the directivity: the enclosure material and internal lining also absorb sound energy, further reducing the emitted noise.
Input Data and Source Modelling
Depending on machine size, geometry, and radiation characteristics, sound sources should be represented using different levels of detail to capture both emitted sound power and directivity. Typical input data, such as sound power level, workstation sound pressure levels (LpA) and geometric information (including relevant material properties such as absorption and transmission), are obtained from manufacturer data, literature sources, and measurements in existing plants. Because true free-field conditions rarely exist around installed machines, near-field measurements combined with free-field simulation can support practical source modelling and calibration (Fig. 5).
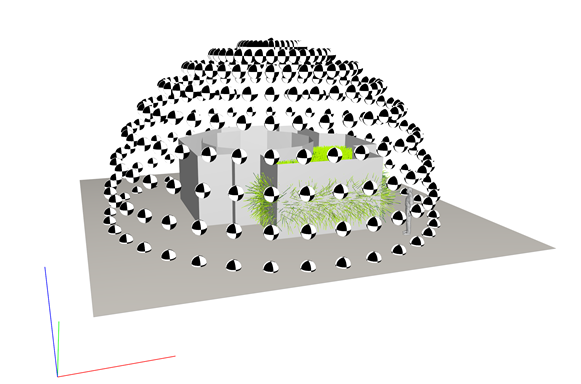
Figure 5: Enveloping surface around a filling machine for determining the sound power radiated by the source group after source modelling and calibration (in combination with free-field simulation) [6].
Ideally, machine suppliers provide an acoustic model of the equipment, including sources and geometry. Such detailed source models can be created and stored as separate files and then imported directly into prediction models of complete industrial halls.
Conclusion
Measurements are essential to document the existing situation in industrial halls, but they often cannot reliably predict how effective a retrofit measure will be once installed under real geometric and operational constraints. Prediction-based methods close this gap by enabling transparent, reproducible variant comparisons—both in early design and in existing plants—helping to avoid over-dimensioned solutions and costly rework. The examples shown illustrate how typical measures such as baffle ceilings, local barriers, and enclosures can be evaluated not only locally at workstations, but across the entire facility. In this sense, “Predict, Don’t Repair” makes noise control plannable and verifiable, turning the acoustic effects of vibrating machinery and industrial processes into a measurable, design-driven outcome and supporting better, safer and truly “good vibrations” at the workplace.
Literature:
[1] OSHA, 29 CFR 1910.95 Occupational noise exposure (U.S. Department of Labor).
[2] NIOSH Pub. 98-126
[3] EU, Directive 2003/10/EC (Noise at work), 2003.
[4] DataKustik – CadnaR – Industry Acoustics (accessed: 12 May 2026)
[5] DIN 38457:2025-05; Acoustics – Software for the calculation for workspaces – Quality assurance of software-implemented methods
[6] DIN EN ISO 3744:2011-02; Acoustics – Determination of sound power levels and sound energy levels of noise sources using sound pressure – Engineering methods for an essentially free field over a reflecting plane