Quantifying vibration variability in additively manufactured materials

By Christina J. Naify
The rapid growth of research in architected acoustic materials has been enabled by a contemporary growth in additive manufacturing (AM) advancement and accessibility. Extensive research over the last two decades has demonstrated the ability to tailor sub-wavelength structure and control wave phenomena with exotic properties such as stop bands, wave focusing and steering, and non-reciprocity. However, despite the large number of studies conducted which exploit additive processes to produce complex designs, only a handful of studies account for manufacturing variability on the acoustic or elastic response of AM components [Katch 2023; Qin 2025]. The majority of structures studied in the literature include experimental data from a single sample or small set of samples for a given geometry. While the layer-by-layer nature of additive processes is known to lead to variability in properties depending on print settings, sample orientation, or sample size the information supplied by base material vendors does not provide adequate bounds for material properties.
The impact of limited study on manufacturing processes is uncertainty in as-printed material elastic properties and material losses in the design process. In order to reliably and repeatably utilize AM for acoustic and vibration applications it is increasingly important to understand the effect of print-to-print variation of samples and to have accurate material properties as an input to design models. This article highlights recent efforts to systematically investigate variability resulting from the print process on vibration response. Specifically, two related efforts quantified material properties of printed components across a range of printers and isolated influence of the variability of different printers compared to print settings.
Interlaboratory study and sample characterization
Interlaboratory studies are widely used to quantify and isolate the effects of, for example manufacturing[Fusaro 2023; Zieliński 2020], modeling or test processes [Horoshenkov 2007]. In this study, variation in the elastic response of fused deposition modeling (FDM)-printed materials was quantified using a non-destructive method of vibration analysis of slender beams. Test samples were printed on different printers at different research institutions and tested at a single location in order to isolate variability of the printer rather than the test process. A uniform geometry file, select printer settings, and base material were utilized in order to exploit any printer-based differences. The chosen geometry for the study was selected to meet key criteria. First, the design should be easily printable using the method of the study, in this case FDM. The dimensions of the part should enable printing on a wide range of printers in order to fabricate the study test articles on as many printers as possible within the participating institutions. An example of a test article used the study was a slender beam with embedded asymmetric resonator located at the beam’s midpoint.
Planning for the study began with discussions among study participants to ensure that each participant had at least one printer able to produce the study samples and slicer settings capable of accommodating the required print parameters. Factors such as printer bed size, material processing, and customizable settings were discussed. It was decided that the sample material to be evaluated in this study would be a commercially available polylactic acid (PLA) blend. Each participant was provided with a common standard triangle language (STL) file generated from a 3D model of the part created in SolidWorks and were encouraged to use whichever printers they had available to print three copies of the sample. All samples were collected at a test location and evaluated using a process involving mounting the slender beams in a vibration shaker and measuring frequency-dependent velocity using a laser vibrometer. Uniform boundary conditions were enforced by clamping the ends of the beams with a set value torque wrench. The direction of excitation of the beams is in the smallest dimension marked thickness in Fig 1.
Interlaboratory study results
Results of the interlaboratory study were compiled from sample sets printed on nine individual printers from six institutions [Naify 2024]. The dimensions and mass of all samples was carefully measuring using digital calipers and a digital balance respectively. Variation in length, width, and thickness was within 1, 5, and 20 percent respectively relative to the as-designed values. Variation in mass was found to vary by 20 percent. Density was calculated for each sample from measured mass and volume and was within 10 percent of the value provided by the manufacturer of 1.2 g/cc. Most of the samples had average densities lower than the expected value.
The filament manufacturer also provides a single value for Young’s modulus which was 3.07 GPa, though no information is provided about print settings for that value. Determination of material properties from the vibration response of the slender beams utilized an inversion process based on treating the beams as Euler-Bernoulli (EB) beams. The EB inversion process utilized the mathematical equation for vibration of a slender beam to fit to identify best-fit complex Young’s modulus to experimental data via a minimization algorithm. A flow chart of the inversion process is shown in Fig. 2 above a snapshot of measured frequency response function and the EB predicted best-fit for that data set. Resulting modulii ranged from 2.4 GPa to 3.2 GPa and loss factors ranged from .032 to .065. The sample-to-sample variation within each printer set had a maximum value of around 0.1 GPa showing good repeatability from each printer.
Expanded study results
While the interlaboratory study provide useful metrics for printer-to-printer variation across a large set of printers, the small number of samples from each printer and variation in settings used at each institution resulted in lingering questions about both the sample-to-sample variation and the effects of print settings on properties. To address these shortcomings a follow-on study was conducted which involved a larger data set of 20 samples per printer and controlled settings across printers. A control data set was printed using manufacturer-recommended settings on an FDM printer (settings on Printer 1.1). The second sample set was printed on a separate printer using the same printer settings (settings on Printer 2.1). Finally, a sample set was printed using different settings on the second printer (settings on Printer 2.2). In all cases, material from a single spool of base material was used.
Violin plots of the data show the distribution of dimensions and mass as shown in Fig. 3. The violin plots are distributed to scale the variables across each dataset for fair comparisons. Normalization was set relative to the interquartile range (IQR) where IQR is the range between the 25th and 75th percentiles, to help reduce the influence of outliers. All normalized values represent the distance (in IQRs) from the median of 0. Following the inversion process used on the interlaboratory study, complex moduli for each data set were calculated as shown in Fig 2 (right).
Similar distributions of values were found for the length and width of samples from all three data sets examined. For measured thickness, which is the driving dimension for the vibration of thin beams examined in this study, the set from Printer 2.2 showed a significantly tighter distribution than the other two sets. The implication of collecting a larger data set is highlighted in the occurrence of outlier values, especially notable in the thickness values from Set 2.1. Similarly, the mass distributions revealed a bimodal behavior and samples were printed in two groups.
Conclusions
The studies described here provide insight into variability in the vibration response of printed structures across printers, across printer settings, and from sample-to-sample within a single printer and setting set. Key takeaways from the study include the need to assume variability of around 20 percent in material properties in component design and the need to assess large enough data sets to provide further bounds on expected response.
Acknowledgements
Thank you to Nathan Geib, Vinh Pham and Gael Nuno who contributed to the data collection in this article.
References
Fusaro, G., Barbaresi, L., Cingolani, M., Garai, M., Ida, E., Prato, A. and Schiavi, A., 2023. Investigation of the impact of additive manufacturing techniques on the acoustic performance of a coiled-up resonator. The Journal of the Acoustical Society of America, 153(5), pp.2921-2921.
Horoshenkov, K.V., Khan, A., Bécot, F.X., Jaouen, L., Sgard, F., Renault, A., Amirouche, N., Pompoli, F., Prodi, N., Bonfiglio, P. and Pispola, G., 2007. Reproducibility experiments on measuring acoustical properties of rigid-frame porous media (round-robin tests). The Journal of the Acoustical Society of America, 122(1), pp.345-353.
Katch, L., Moghaddaszadeh, M., Willey, C.L., Juhl, A.T., Nouh, M. and Argüelles, A.P., 2023. Analysis of geometric defects in square locally resonant phononic crystals: A comparative study of modeling approaches. The Journal of the Acoustical Society of America, 154(5), pp.3052-3061.
Naify, C.J., Cushing, C.W., Geib, N.P., Wash, M., Allison, J., Sieck, C.F., Ikei, A.K., Ware, A., Bowling, T., Beck, B.S. and Zawaski, C., 2024. Effects of printer variation on vibration response of fused deposition modeling-fabricated elastic beams with symmetric and asymmetric resonators: A round robin study. The Journal of the Acoustical Society of America, 155(3_Supplement), pp.A267-A267.
Qin, F., Zhang, J. and Drinkwater, B.W., 2025. The effects of manufacturing errors on the performance of acoustic metamaterial lenses operating in the mhz regime. Small Science, 5(4), p.2400481.
Zieliński, Tomasz G., Kamil C. Opiela, Piotr Pawłowski, Nicolas Dauchez, Thomas Boutin, John Kennedy, Daniel Trimble et al. “Reproducibility of sound-absorbing periodic porous materials using additive manufacturing technologies: Round robin study.” Additive Manufacturing 36 (2020): 101564.
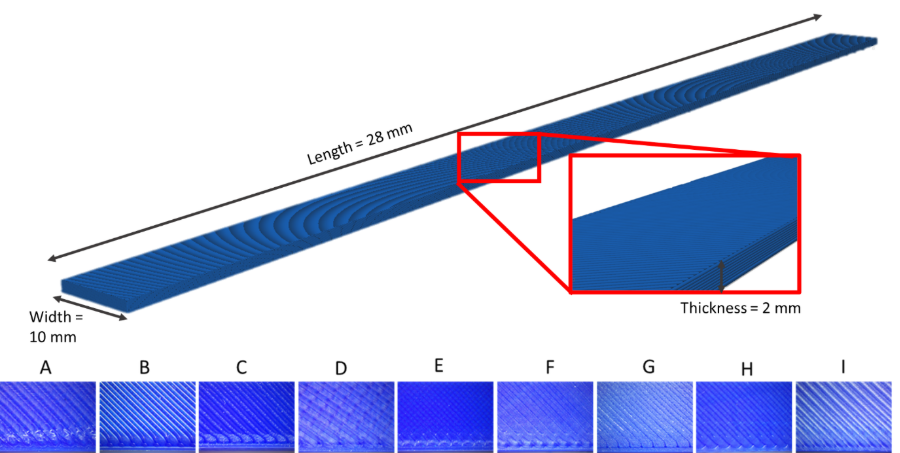
Figure 1: (Top) Slender beams were used as the test specimen of an interlaboratory study. (Bottom)An initial study collected 3 samples from 9 printers provided by 6 institutions. Each institution was instructed to use a common geometry file and optimal settings for their printer. Photographs of the tops of the samples provide qualitative comparison of the different samples. Complex moduli were extracted using experimental data and an inversion algorithm and showed variability of up to 20 percent in moduli for this study.
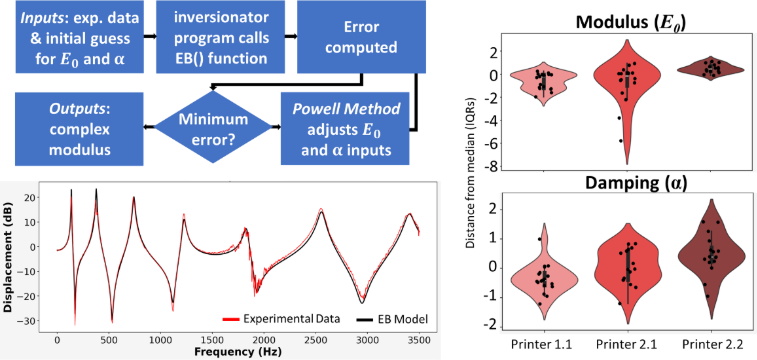
Figure 2: (Left) An inversion algorithm which treated the beams as Euler Bernoulli (EB) beams was used to identify material properties for each experimentally measured data set (bottom left). Moduli and damping values collected from a second set of samples indicated that outliers and a bimodal distribution can further increase the bounds on expected material properties and that both printer and print settings impact results significantly.
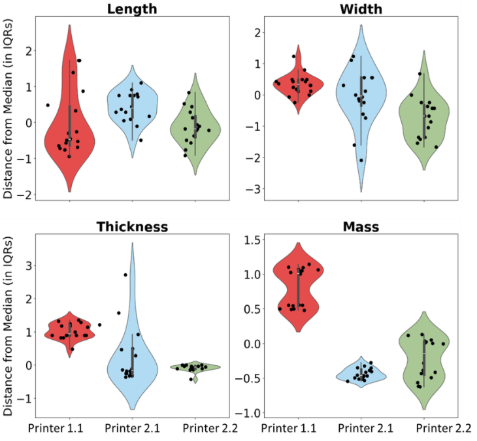
Figure 3: A follow-on study addressed relatively small sample size in the initial study which left lingering questions about sample-to-sample variability. Digital calipers were used to measure dimensions of sets of 20 samples printed on two printers using two sets of settings.