Worldwide Hearing Index 2017

EMBARGOED FOR MARCH 3RD 2017, WORLD HEARING DAY
Report suggests link between hearing loss and noise pollution in cities
- Study from the largest ongoing global digital database regarding hearing loss, with over 200,000 participants
- Residents of Vienna, Austria, have the least amount of hearing loss proportionate to their age, while citizens of Delhi, India, have the most
- Zurich, Switzerland, has the least incidence of noise pollution, and Guangzhou, China, has the highest
- Noise pollution in cities and hearing loss were found to have a 64% positive correlation
- The full results of the study can be found here:http://www.mimi.io/hearingindex
Berlin, Germany, March 3rd 2017 – For World Hearing Day, digital hearing appMimi has published a report detailinghearing loss around the world. Using data gathered from over 200,000 participants of their hearing test, statistics from the World Health Organization, and the SINTEF report on noise pollution, the study investigates how noise pollution in cities relates to hearing. The company hopes that the data will not only provide a unique insight into the current state of global hearing loss, but will also act as a call to action for individuals and health care providers to make better investments concerning aural health.
Dr. Manfred Gross from Charité University Hospital, Berlin, said: “While eye and sight checks are routine for most, ear and hearing exams are not. This is an issue as the earlier hearing loss is detected, the better the chances are for preventing further damage.”
To conduct the report, data was gathered from theMimi hearing test app, which allows participants to enter their age and gender, and then test their hearing. The Worldwide Hearing Index presents the average difference between a participant’s true age and their hearing age in each location.*
The Average Hearing Loss Index was found to have a 64% positive correlation with Noise Pollution levels in each city, indicating hearing loss may be an outcome of living in these cities. The results of the Hearing Loss Index of each city and the Noise Pollution were mapped to range between 0 and 1. The sum of these two rankings were combined to give an overall Combined Hearing Loss Rank.
For the full methodology see the base of the press release and the studyresults page.
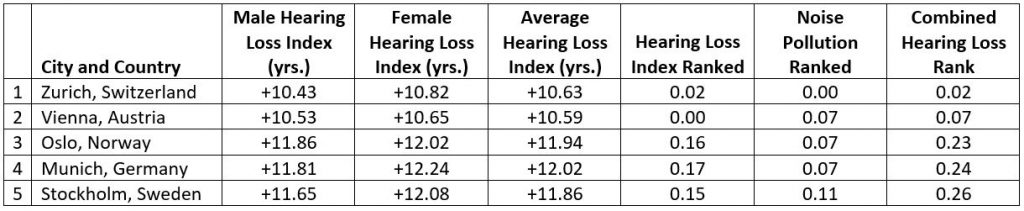
The 5 cities with the lowest Combined Hearing Loss are:
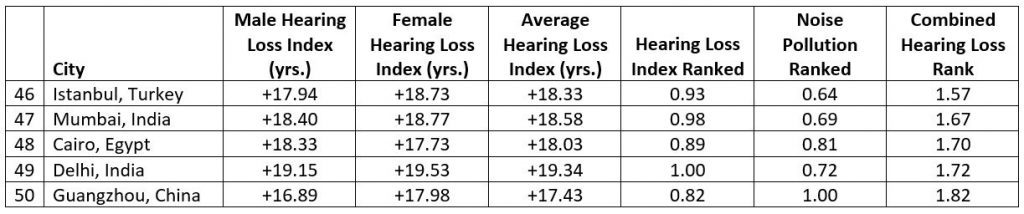
The 5 cities with the highest Combined Hearing Loss are:
Residents of *|City|*, *|Country|* were found to have an average additional hearing age of *|Average|* years, placing in position *|mimi rank|* out of the 50 cities included. This can be further broken down by sexes, with males found to have an average hearing age of *|Male|* years and females *|Female|* years. When combined with the rank of Noise Pollution, *|City|* ranked *|Overall|* out of the 50 cities included. It is this factor which ranks the tables above.
Findings of interest from the report include:
- Residents of Vienna, Austria, were found to have the smallest Average Hearing Loss, meaning they suffered the least amount of hearing loss proportionate to their age.
- Residents of Delhi, India, were found to have the greatest Average Hearing Loss within the study, meaning they suffered the most amount of hearing loss proportionate to their age.
The findings from the Mimi app are in agreement with current research in this area, which expects the average person to have a hearing loss of +10–20 years.
The full results of the study are represented in figure 1. Noise Pollution is plotted against Hearing Loss in order to visually demonstrate the positive correlation between the two factors.
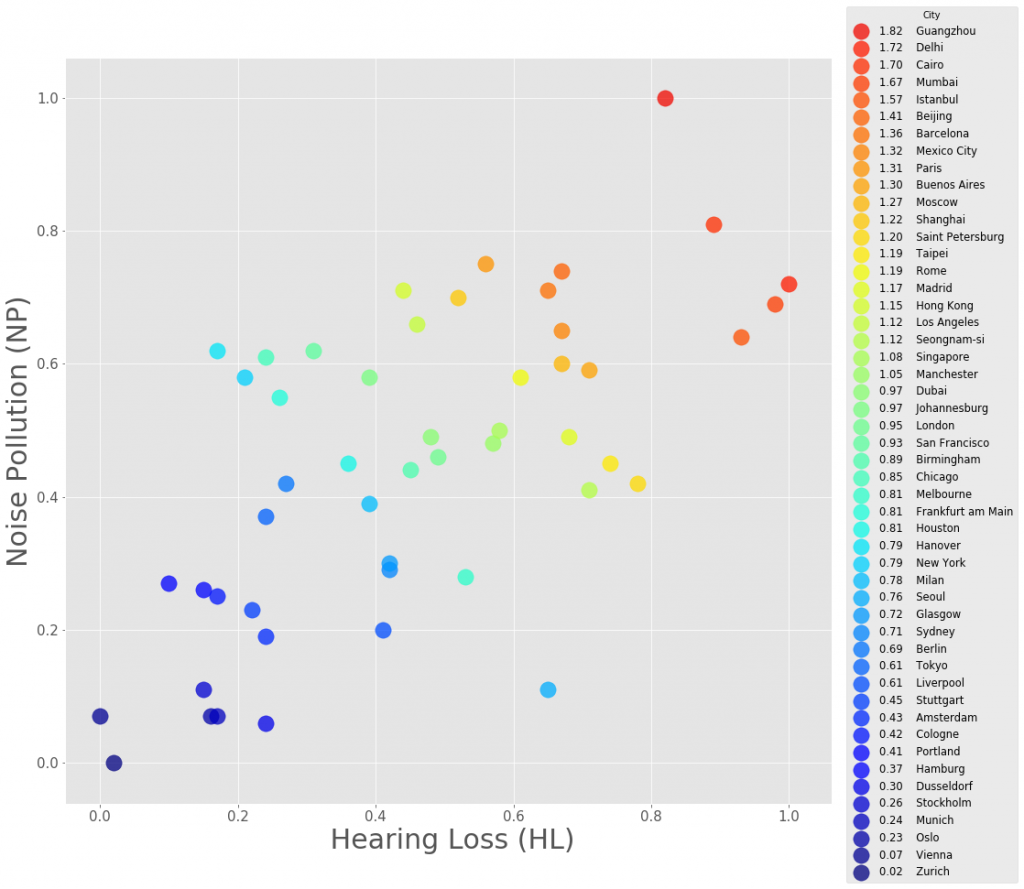
Figure 1. This shows the relationship between the Noise Pollution (NP) and Hearing Loss (HL) indicators. Each city in the ranking is represented by a colored circle mapped to the respective World Hearing Loss Index. This chart suggests that the higher the levels of noise pollution in a city, the higher the incidence of hearing loss. Source: Mimi. For the high resolution image or questions please send enquiries to ricky@abcd.agency.
“With the Worldwide Hearing Index, we are aiming to create visibility and highlight the importance of good hearing and hearing health. Hearing is one of our most important senses, but has no lobby and little awareness so far. Smartphone technologies nowadays makes it easy to take a first step, test your hearing and get informed about one’s hearing health,” adds Dr. Henrik Matthies, Managing Director of Mimi Hearing Technologies.
###
Publishers are allowed to publish this data and graphics but we kindly ask that you give credit and link to the source. For further enquiries do not hesitate to reply to this email or to directly emailricky@acbd.agency
* The location of the participants in the Mimi Hearing app was determined via their geolocation and all data was anonymized.
* 50 cities with enough available data to form a representative sample were selected.
Methodology
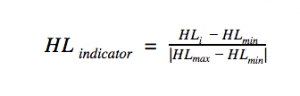
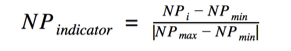
The Worldwide Hearing Index focuses on two factors: Hearing Loss (HL), which focuses on how much hearing loss the residents have, disregarding expected loss experienced from natural aging, and noise pollution (NP). The difference between the participants age and their actual hearing age was calculated in regards to the ISO Standard, resulting in the indicator “Hearing Loss” (HL). The data was normalized within the sample for clearer representation into 0–1 (0: min, 1: max). Cities with a greater HL result in the ranking show proportionately worse hearing in relation to the age of the participants. Data was also collected from the World Health Organization and the SINTEF report on Noise Pollution (NP) and is also presented as 0–1 (0: min, 1: max). The data has a 0.64 Pearson’s correlation coefficient, meaning that the two factors demonstrate a 64% positive correlation. These two indicators were then added together to show how the aforementioned factors contribute simultaneously, and the study was ranked based on this result. Further explanation of the methodology and a full list of the results can be found on the landing page.
We used data gathered from the digital Mimi hearing test app, which allows participants to enter their age, sex, and to test their hearing age. The hearing age is calculated under the ISO 7029 Standard 1999:2013, Acoustics: Estimation of noise-induced hearing loss, ICS:12.140, (2013). The location of the participants was determined via their geolocation. From this database, we selected 50 cities where enough data was available to form a representative sample; thus, cities without sufficient data were not included in the study.
From the available data, we looked at the Hearing Loss of the user, HL, or, defined as:
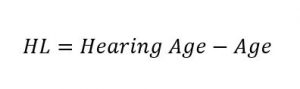
Thus, a negative value of HL, or a small absolute HL but high Hearing Age and Age, implies that the user is presenting hearing loss. This number represents the absolute value of the difference between a user’s actual age and their hearing age. Based on this number we ranked these results for both male and female. We calculated the average HL between genders. Based on these results we extrapolated a HL for each of the 50 cities. The data is normalized within the sample by representing the HL of the city from 0–1. (0: min, 1: max).
We then collected data from the World Health Organization and SINTEF report on noise pollution and ranked the cities within the samples to form the Noise Pollution indicator (NP). This data was also normalized within the sample by representing the noise pollution of the city from 0–1. (0: min, 1: max).
Each city’s score on the World Hearing Index is defined as the sum of these two indicators. This value allows us to understand how each city on the index performs in terms of these two factors in comparison to the others on the list.
http://www.sciencedirect.com/science/article/pii/S037859551300035X
About Mimi: The Mimi Hearing Technologies GmbH (https://mimi.io/) defines the future of sound and redefines the way how people listen and experience music. The in-house developed smartphone based technology by hearing scientist and audio engineers personalizes sound for a more rich and clear listening experience and helps to hear lost frequencies again. Mimi drives innovation in the fields of hearing test software, fitting, and sound processing. In the past years Mimi has tested almost a million ears in over 80 countries with the Mimi Hearing Test and developed the first app which truly personalizes sound to your unique hearing profile with Mimi Music.